Immigrants from Israel vs Immigrants from Canada Unemployment Among Ages 35 to 44 years
COMPARE
Immigrants from Israel
Immigrants from Canada
Unemployment Among Ages 35 to 44 years
Unemployment Among Ages 35 to 44 years Comparison
Immigrants from Israel
Immigrants from Canada
4.5%
UNEMPLOYMENT AMONG AGES 35 TO 44 YEARS
88.1/ 100
METRIC RATING
116th/ 347
METRIC RANK
4.5%
UNEMPLOYMENT AMONG AGES 35 TO 44 YEARS
92.3/ 100
METRIC RATING
98th/ 347
METRIC RANK
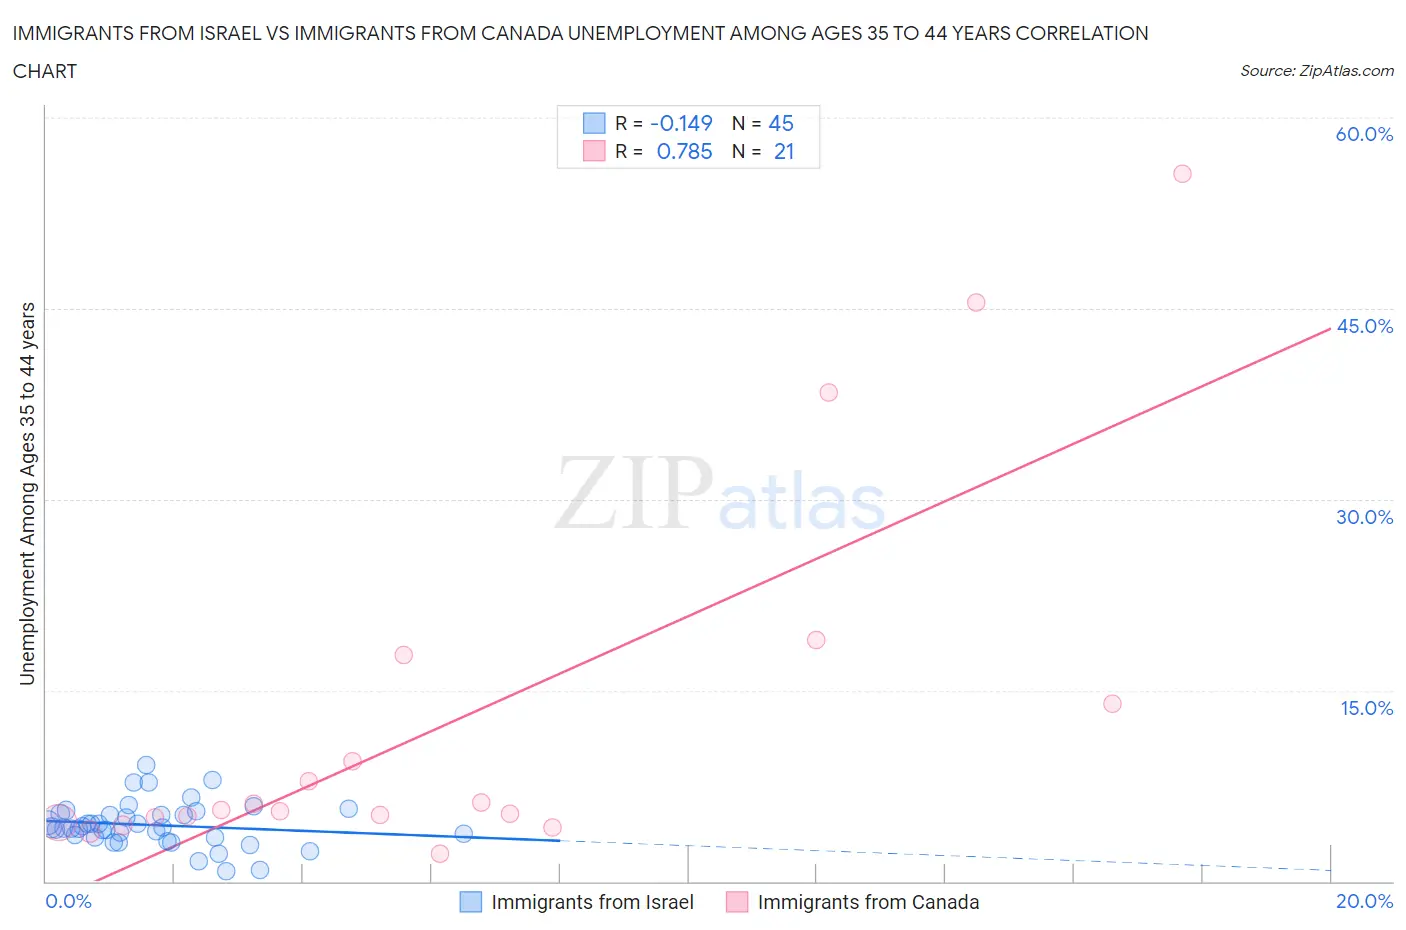
Immigrants from Israel vs Immigrants from Canada Unemployment Among Ages 35 to 44 years Correlation Chart
The statistical analysis conducted on geographies consisting of 207,929,037 people shows a poor negative correlation between the proportion of Immigrants from Israel and unemployment rate among population between the ages 35 and 44 in the United States with a correlation coefficient (R) of -0.149 and weighted average of 4.5%. Similarly, the statistical analysis conducted on geographies consisting of 443,343,768 people shows a strong positive correlation between the proportion of Immigrants from Canada and unemployment rate among population between the ages 35 and 44 in the United States with a correlation coefficient (R) of 0.785 and weighted average of 4.5%, a difference of 0.90%.
Unemployment Among Ages 35 to 44 years Correlation Summary
| Measurement | Immigrants from Israel | Immigrants from Canada |
| Minimum | 0.80% | 2.2% |
| Maximum | 9.2% | 55.6% |
| Range | 8.4% | 53.4% |
| Mean | 4.4% | 12.9% |
| Median | 4.2% | 5.6% |
| Interquartile 25% (IQ1) | 3.4% | 4.8% |
| Interquartile 75% (IQ3) | 5.3% | 15.9% |
| Interquartile Range (IQR) | 1.9% | 11.0% |
| Standard Deviation (Sample) | 1.7% | 15.0% |
| Standard Deviation (Population) | 1.7% | 14.6% |
Demographics Similar to Immigrants from Israel and Immigrants from Canada by Unemployment Among Ages 35 to 44 years
In terms of unemployment among ages 35 to 44 years, the demographic groups most similar to Immigrants from Israel are Maltese (4.5%, a difference of 0.010%), Immigrants from Greece (4.5%, a difference of 0.020%), Macedonian (4.5%, a difference of 0.040%), Immigrants from Italy (4.5%, a difference of 0.060%), and Immigrants from Czechoslovakia (4.5%, a difference of 0.20%). Similarly, the demographic groups most similar to Immigrants from Canada are Immigrants from Egypt (4.5%, a difference of 0.010%), Immigrants from France (4.5%, a difference of 0.050%), Italian (4.5%, a difference of 0.10%), Immigrants from Netherlands (4.5%, a difference of 0.11%), and Immigrants from Sudan (4.5%, a difference of 0.14%).
| Demographics | Rating | Rank | Unemployment Among Ages 35 to 44 years |
| Immigrants | France | 92.5 /100 | #97 | Exceptional 4.5% |
| Immigrants | Canada | 92.3 /100 | #98 | Exceptional 4.5% |
| Immigrants | Egypt | 92.3 /100 | #99 | Exceptional 4.5% |
| Italians | 91.9 /100 | #100 | Exceptional 4.5% |
| Immigrants | Netherlands | 91.9 /100 | #101 | Exceptional 4.5% |
| Immigrants | Sudan | 91.8 /100 | #102 | Exceptional 4.5% |
| Welsh | 91.6 /100 | #103 | Exceptional 4.5% |
| Finns | 91.6 /100 | #104 | Exceptional 4.5% |
| Immigrants | Saudi Arabia | 91.3 /100 | #105 | Exceptional 4.5% |
| Immigrants | North America | 91.1 /100 | #106 | Exceptional 4.5% |
| Immigrants | North Macedonia | 90.7 /100 | #107 | Exceptional 4.5% |
| New Zealanders | 90.3 /100 | #108 | Exceptional 4.5% |
| Romanians | 90.3 /100 | #109 | Exceptional 4.5% |
| Immigrants | Kazakhstan | 90.0 /100 | #110 | Excellent 4.5% |
| Immigrants | Nicaragua | 89.8 /100 | #111 | Excellent 4.5% |
| Immigrants | Czechoslovakia | 89.2 /100 | #112 | Excellent 4.5% |
| Immigrants | Italy | 88.4 /100 | #113 | Excellent 4.5% |
| Macedonians | 88.3 /100 | #114 | Excellent 4.5% |
| Maltese | 88.1 /100 | #115 | Excellent 4.5% |
| Immigrants | Israel | 88.1 /100 | #116 | Excellent 4.5% |
| Immigrants | Greece | 87.9 /100 | #117 | Excellent 4.5% |