Immigrants from Israel vs Belgian Unemployment Among Ages 35 to 44 years
COMPARE
Immigrants from Israel
Belgian
Unemployment Among Ages 35 to 44 years
Unemployment Among Ages 35 to 44 years Comparison
Immigrants from Israel
Belgians
4.5%
UNEMPLOYMENT AMONG AGES 35 TO 44 YEARS
88.1/ 100
METRIC RATING
116th/ 347
METRIC RANK
4.3%
UNEMPLOYMENT AMONG AGES 35 TO 44 YEARS
98.7/ 100
METRIC RATING
41st/ 347
METRIC RANK
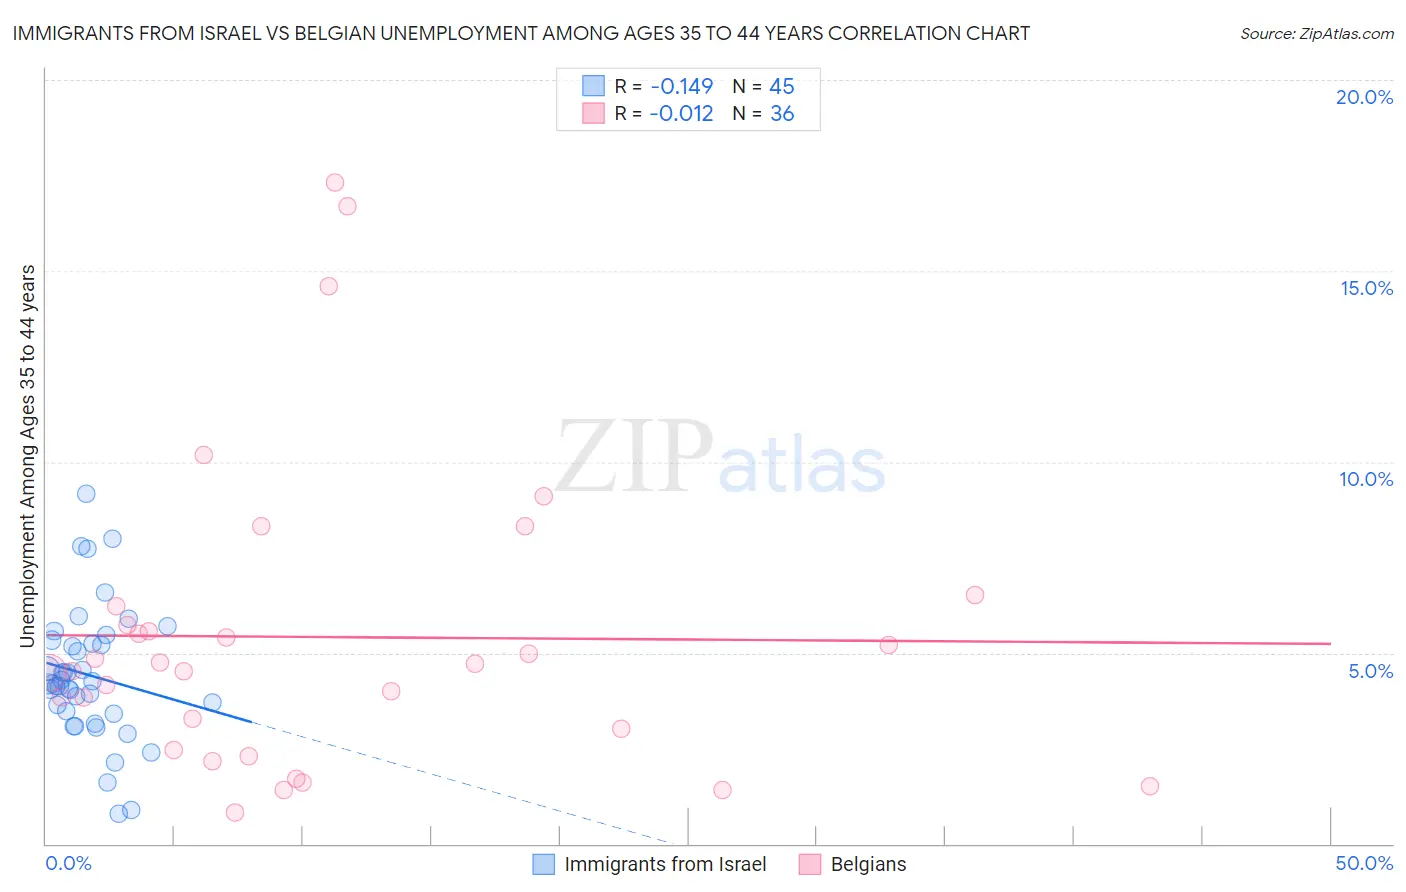
Immigrants from Israel vs Belgian Unemployment Among Ages 35 to 44 years Correlation Chart
The statistical analysis conducted on geographies consisting of 207,929,037 people shows a poor negative correlation between the proportion of Immigrants from Israel and unemployment rate among population between the ages 35 and 44 in the United States with a correlation coefficient (R) of -0.149 and weighted average of 4.5%. Similarly, the statistical analysis conducted on geographies consisting of 346,141,215 people shows no correlation between the proportion of Belgians and unemployment rate among population between the ages 35 and 44 in the United States with a correlation coefficient (R) of -0.012 and weighted average of 4.3%, a difference of 4.5%.
Unemployment Among Ages 35 to 44 years Correlation Summary
| Measurement | Immigrants from Israel | Belgian |
| Minimum | 0.80% | 0.82% |
| Maximum | 9.2% | 17.3% |
| Range | 8.4% | 16.5% |
| Mean | 4.4% | 5.4% |
| Median | 4.2% | 4.6% |
| Interquartile 25% (IQ1) | 3.4% | 2.7% |
| Interquartile 75% (IQ3) | 5.3% | 6.0% |
| Interquartile Range (IQR) | 1.9% | 3.2% |
| Standard Deviation (Sample) | 1.7% | 4.0% |
| Standard Deviation (Population) | 1.7% | 3.9% |
Similar Demographics by Unemployment Among Ages 35 to 44 years
Demographics Similar to Immigrants from Israel by Unemployment Among Ages 35 to 44 years
In terms of unemployment among ages 35 to 44 years, the demographic groups most similar to Immigrants from Israel are Maltese (4.5%, a difference of 0.010%), Immigrants from Greece (4.5%, a difference of 0.020%), Irish (4.5%, a difference of 0.030%), Macedonian (4.5%, a difference of 0.040%), and Immigrants from Italy (4.5%, a difference of 0.060%).
| Demographics | Rating | Rank | Unemployment Among Ages 35 to 44 years |
| Romanians | 90.3 /100 | #109 | Exceptional 4.5% |
| Immigrants | Kazakhstan | 90.0 /100 | #110 | Excellent 4.5% |
| Immigrants | Nicaragua | 89.8 /100 | #111 | Excellent 4.5% |
| Immigrants | Czechoslovakia | 89.2 /100 | #112 | Excellent 4.5% |
| Immigrants | Italy | 88.4 /100 | #113 | Excellent 4.5% |
| Macedonians | 88.3 /100 | #114 | Excellent 4.5% |
| Maltese | 88.1 /100 | #115 | Excellent 4.5% |
| Immigrants | Israel | 88.1 /100 | #116 | Excellent 4.5% |
| Immigrants | Greece | 87.9 /100 | #117 | Excellent 4.5% |
| Irish | 87.9 /100 | #118 | Excellent 4.5% |
| Nicaraguans | 87.6 /100 | #119 | Excellent 4.5% |
| Ethiopians | 87.1 /100 | #120 | Excellent 4.5% |
| Immigrants | South Africa | 86.8 /100 | #121 | Excellent 4.5% |
| Sri Lankans | 86.8 /100 | #122 | Excellent 4.5% |
| Basques | 86.3 /100 | #123 | Excellent 4.5% |
Demographics Similar to Belgians by Unemployment Among Ages 35 to 44 years
In terms of unemployment among ages 35 to 44 years, the demographic groups most similar to Belgians are German (4.3%, a difference of 0.010%), Eastern European (4.3%, a difference of 0.080%), Zimbabwean (4.3%, a difference of 0.10%), Immigrants from Malaysia (4.3%, a difference of 0.10%), and Palestinian (4.3%, a difference of 0.16%).
| Demographics | Rating | Rank | Unemployment Among Ages 35 to 44 years |
| Jordanians | 99.0 /100 | #34 | Exceptional 4.3% |
| Luxembourgers | 99.0 /100 | #35 | Exceptional 4.3% |
| Mongolians | 98.9 /100 | #36 | Exceptional 4.3% |
| Immigrants | Zimbabwe | 98.9 /100 | #37 | Exceptional 4.3% |
| Burmese | 98.9 /100 | #38 | Exceptional 4.3% |
| Palestinians | 98.8 /100 | #39 | Exceptional 4.3% |
| Zimbabweans | 98.8 /100 | #40 | Exceptional 4.3% |
| Belgians | 98.7 /100 | #41 | Exceptional 4.3% |
| Germans | 98.7 /100 | #42 | Exceptional 4.3% |
| Eastern Europeans | 98.7 /100 | #43 | Exceptional 4.3% |
| Immigrants | Malaysia | 98.7 /100 | #44 | Exceptional 4.3% |
| Immigrants | Korea | 98.4 /100 | #45 | Exceptional 4.3% |
| Immigrants | Belgium | 98.4 /100 | #46 | Exceptional 4.3% |
| British | 98.3 /100 | #47 | Exceptional 4.4% |
| Bhutanese | 98.2 /100 | #48 | Exceptional 4.4% |