Immigrants from Hungary vs Immigrants from Western Europe Unemployment Among Women with Children Ages 6 to 17 years
COMPARE
Immigrants from Hungary
Immigrants from Western Europe
Unemployment Among Women with Children Ages 6 to 17 years
Unemployment Among Women with Children Ages 6 to 17 years Comparison
Immigrants from Hungary
Immigrants from Western Europe
8.9%
UNEMPLOYMENT AMONG WOMEN WITH CHILDREN AGES 6 TO 17 YEARS
63.4/ 100
METRIC RATING
160th/ 347
METRIC RANK
9.1%
UNEMPLOYMENT AMONG WOMEN WITH CHILDREN AGES 6 TO 17 YEARS
14.1/ 100
METRIC RATING
205th/ 347
METRIC RANK
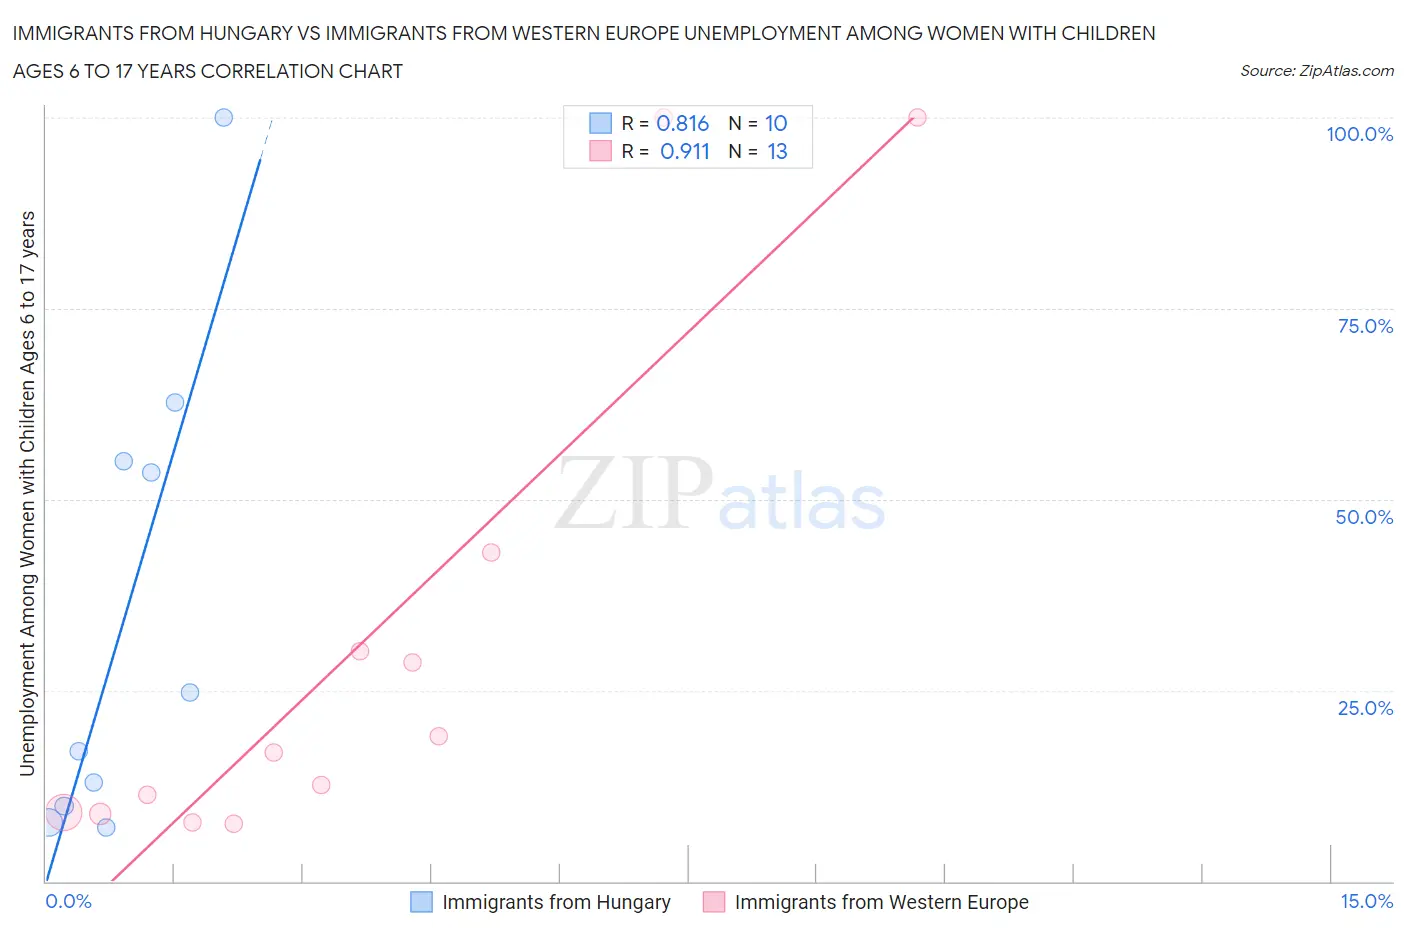
Immigrants from Hungary vs Immigrants from Western Europe Unemployment Among Women with Children Ages 6 to 17 years Correlation Chart
The statistical analysis conducted on geographies consisting of 155,870,512 people shows a very strong positive correlation between the proportion of Immigrants from Hungary and unemployment rate among women with children between the ages 6 and 17 in the United States with a correlation coefficient (R) of 0.816 and weighted average of 8.9%. Similarly, the statistical analysis conducted on geographies consisting of 331,705,739 people shows a near-perfect positive correlation between the proportion of Immigrants from Western Europe and unemployment rate among women with children between the ages 6 and 17 in the United States with a correlation coefficient (R) of 0.911 and weighted average of 9.1%, a difference of 2.6%.
Unemployment Among Women with Children Ages 6 to 17 years Correlation Summary
| Measurement | Immigrants from Hungary | Immigrants from Western Europe |
| Minimum | 7.0% | 7.5% |
| Maximum | 100.0% | 100.0% |
| Range | 93.0% | 92.5% |
| Mean | 35.0% | 30.4% |
| Median | 20.8% | 16.8% |
| Interquartile 25% (IQ1) | 9.9% | 8.9% |
| Interquartile 75% (IQ3) | 55.0% | 36.5% |
| Interquartile Range (IQR) | 45.1% | 27.6% |
| Standard Deviation (Sample) | 31.3% | 32.7% |
| Standard Deviation (Population) | 29.7% | 31.4% |
Similar Demographics by Unemployment Among Women with Children Ages 6 to 17 years
Demographics Similar to Immigrants from Hungary by Unemployment Among Women with Children Ages 6 to 17 years
In terms of unemployment among women with children ages 6 to 17 years, the demographic groups most similar to Immigrants from Hungary are Spanish (8.9%, a difference of 0.020%), Immigrants from Guyana (8.9%, a difference of 0.020%), Immigrants from Chile (8.9%, a difference of 0.090%), Immigrants from Belgium (8.9%, a difference of 0.11%), and Osage (8.9%, a difference of 0.12%).
| Demographics | Rating | Rank | Unemployment Among Women with Children Ages 6 to 17 years |
| Immigrants | Europe | 73.4 /100 | #153 | Good 8.9% |
| Vietnamese | 72.1 /100 | #154 | Good 8.9% |
| Immigrants | Greece | 71.8 /100 | #155 | Good 8.9% |
| Osage | 65.9 /100 | #156 | Good 8.9% |
| Immigrants | Belgium | 65.6 /100 | #157 | Good 8.9% |
| Immigrants | Chile | 65.3 /100 | #158 | Good 8.9% |
| Spanish | 63.8 /100 | #159 | Good 8.9% |
| Immigrants | Hungary | 63.4 /100 | #160 | Good 8.9% |
| Immigrants | Guyana | 63.0 /100 | #161 | Good 8.9% |
| Immigrants | Netherlands | 60.8 /100 | #162 | Good 8.9% |
| Mexican American Indians | 60.6 /100 | #163 | Good 8.9% |
| Ukrainians | 59.7 /100 | #164 | Average 8.9% |
| Immigrants | Micronesia | 59.2 /100 | #165 | Average 8.9% |
| Moroccans | 58.3 /100 | #166 | Average 8.9% |
| Immigrants | England | 57.7 /100 | #167 | Average 8.9% |
Demographics Similar to Immigrants from Western Europe by Unemployment Among Women with Children Ages 6 to 17 years
In terms of unemployment among women with children ages 6 to 17 years, the demographic groups most similar to Immigrants from Western Europe are Immigrants from Canada (9.1%, a difference of 0.10%), Maltese (9.1%, a difference of 0.11%), Immigrants from Middle Africa (9.1%, a difference of 0.13%), Immigrants from North America (9.2%, a difference of 0.13%), and Immigrants from Trinidad and Tobago (9.1%, a difference of 0.22%).
| Demographics | Rating | Rank | Unemployment Among Women with Children Ages 6 to 17 years |
| Guyanese | 21.8 /100 | #198 | Fair 9.1% |
| Czechoslovakians | 20.8 /100 | #199 | Fair 9.1% |
| Trinidadians and Tobagonians | 18.2 /100 | #200 | Poor 9.1% |
| Immigrants | Trinidad and Tobago | 16.7 /100 | #201 | Poor 9.1% |
| Immigrants | Middle Africa | 15.6 /100 | #202 | Poor 9.1% |
| Maltese | 15.3 /100 | #203 | Poor 9.1% |
| Immigrants | Canada | 15.3 /100 | #204 | Poor 9.1% |
| Immigrants | Western Europe | 14.1 /100 | #205 | Poor 9.1% |
| Immigrants | North America | 12.7 /100 | #206 | Poor 9.2% |
| Cubans | 10.9 /100 | #207 | Poor 9.2% |
| Immigrants | Peru | 10.8 /100 | #208 | Poor 9.2% |
| Salvadorans | 10.7 /100 | #209 | Poor 9.2% |
| Finns | 10.0 /100 | #210 | Tragic 9.2% |
| Immigrants | Cuba | 9.6 /100 | #211 | Tragic 9.2% |
| Peruvians | 9.0 /100 | #212 | Tragic 9.2% |