Immigrants from Hong Kong vs Paraguayan Unemployment Among Ages 25 to 29 years
COMPARE
Immigrants from Hong Kong
Paraguayan
Unemployment Among Ages 25 to 29 years
Unemployment Among Ages 25 to 29 years Comparison
Immigrants from Hong Kong
Paraguayans
6.3%
UNEMPLOYMENT AMONG AGES 25 TO 29 YEARS
97.5/ 100
METRIC RATING
69th/ 347
METRIC RANK
6.6%
UNEMPLOYMENT AMONG AGES 25 TO 29 YEARS
60.4/ 100
METRIC RATING
161st/ 347
METRIC RANK
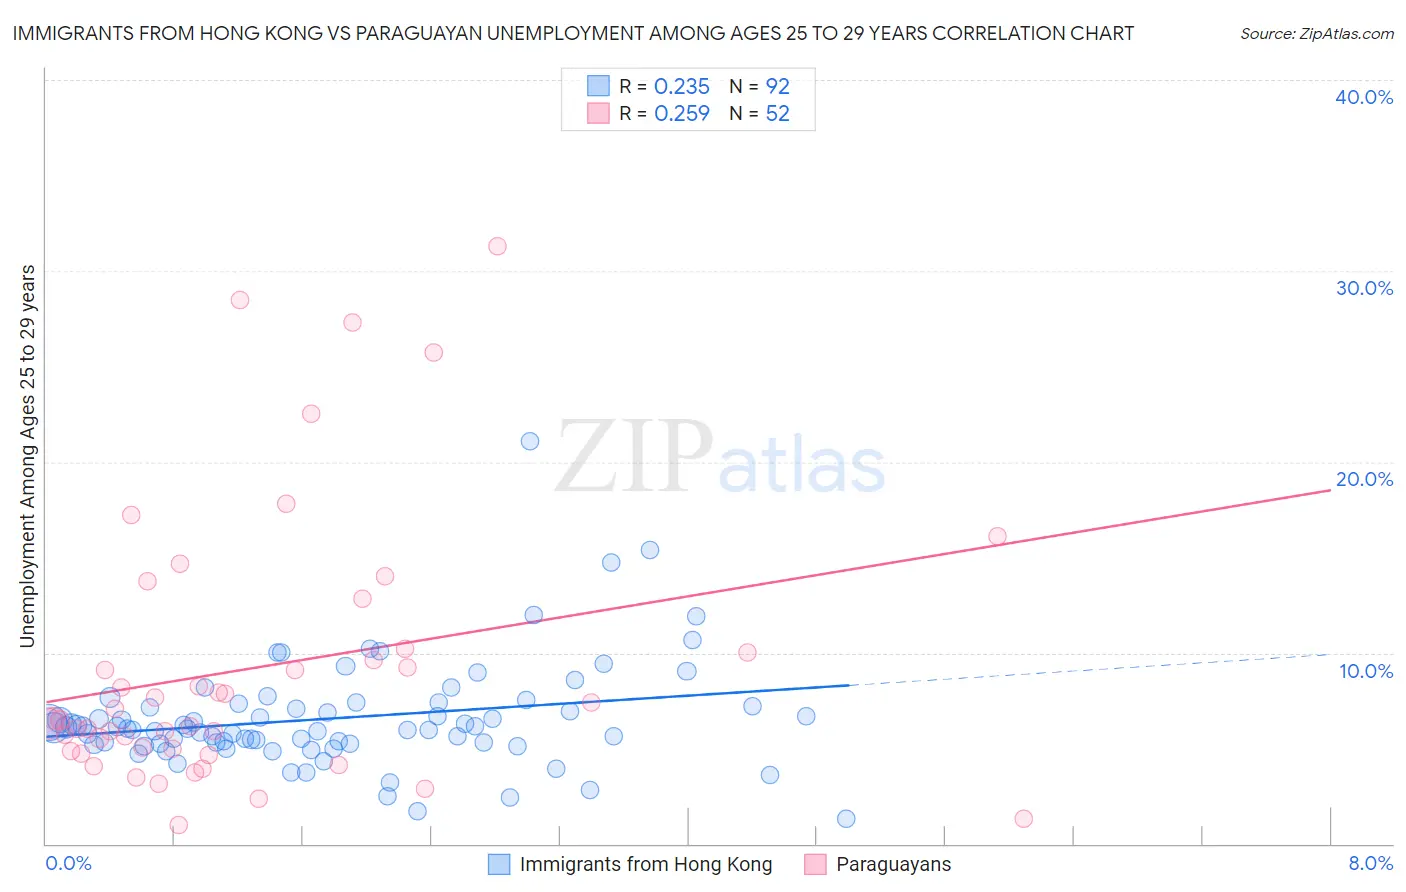
Immigrants from Hong Kong vs Paraguayan Unemployment Among Ages 25 to 29 years Correlation Chart
The statistical analysis conducted on geographies consisting of 247,463,754 people shows a weak positive correlation between the proportion of Immigrants from Hong Kong and unemployment rate among population between the ages 25 and 29 in the United States with a correlation coefficient (R) of 0.235 and weighted average of 6.3%. Similarly, the statistical analysis conducted on geographies consisting of 93,862,342 people shows a weak positive correlation between the proportion of Paraguayans and unemployment rate among population between the ages 25 and 29 in the United States with a correlation coefficient (R) of 0.259 and weighted average of 6.6%, a difference of 5.3%.
Unemployment Among Ages 25 to 29 years Correlation Summary
| Measurement | Immigrants from Hong Kong | Paraguayan |
| Minimum | 1.3% | 1.0% |
| Maximum | 21.1% | 31.3% |
| Range | 19.8% | 30.3% |
| Mean | 6.6% | 9.2% |
| Median | 6.1% | 6.5% |
| Interquartile 25% (IQ1) | 5.3% | 4.9% |
| Interquartile 75% (IQ3) | 7.3% | 10.1% |
| Interquartile Range (IQR) | 2.0% | 5.2% |
| Standard Deviation (Sample) | 2.8% | 7.1% |
| Standard Deviation (Population) | 2.8% | 7.0% |
Similar Demographics by Unemployment Among Ages 25 to 29 years
Demographics Similar to Immigrants from Hong Kong by Unemployment Among Ages 25 to 29 years
In terms of unemployment among ages 25 to 29 years, the demographic groups most similar to Immigrants from Hong Kong are Immigrants from Malaysia (6.3%, a difference of 0.020%), Immigrants from France (6.3%, a difference of 0.060%), Scandinavian (6.3%, a difference of 0.080%), Palestinian (6.3%, a difference of 0.18%), and Indian (Asian) (6.3%, a difference of 0.23%).
| Demographics | Rating | Rank | Unemployment Among Ages 25 to 29 years |
| Immigrants | China | 98.1 /100 | #62 | Exceptional 6.2% |
| Kenyans | 98.0 /100 | #63 | Exceptional 6.3% |
| Immigrants | Sri Lanka | 97.9 /100 | #64 | Exceptional 6.3% |
| Immigrants | Lebanon | 97.8 /100 | #65 | Exceptional 6.3% |
| Indians (Asian) | 97.8 /100 | #66 | Exceptional 6.3% |
| Immigrants | Northern Africa | 97.8 /100 | #67 | Exceptional 6.3% |
| Palestinians | 97.7 /100 | #68 | Exceptional 6.3% |
| Immigrants | Hong Kong | 97.5 /100 | #69 | Exceptional 6.3% |
| Immigrants | Malaysia | 97.5 /100 | #70 | Exceptional 6.3% |
| Immigrants | France | 97.4 /100 | #71 | Exceptional 6.3% |
| Scandinavians | 97.4 /100 | #72 | Exceptional 6.3% |
| Belgians | 97.0 /100 | #73 | Exceptional 6.3% |
| Carpatho Rusyns | 96.9 /100 | #74 | Exceptional 6.3% |
| Immigrants | Jordan | 96.8 /100 | #75 | Exceptional 6.3% |
| Immigrants | Korea | 96.7 /100 | #76 | Exceptional 6.3% |
Demographics Similar to Paraguayans by Unemployment Among Ages 25 to 29 years
In terms of unemployment among ages 25 to 29 years, the demographic groups most similar to Paraguayans are Scottish (6.6%, a difference of 0.020%), Immigrants from Czechoslovakia (6.6%, a difference of 0.020%), Welsh (6.6%, a difference of 0.060%), Immigrants from Russia (6.6%, a difference of 0.070%), and Immigrants from Middle Africa (6.6%, a difference of 0.070%).
| Demographics | Rating | Rank | Unemployment Among Ages 25 to 29 years |
| Colombians | 64.0 /100 | #154 | Good 6.6% |
| Immigrants | Latvia | 63.9 /100 | #155 | Good 6.6% |
| Immigrants | Laos | 63.5 /100 | #156 | Good 6.6% |
| South Africans | 63.5 /100 | #157 | Good 6.6% |
| Immigrants | Russia | 61.5 /100 | #158 | Good 6.6% |
| Welsh | 61.3 /100 | #159 | Good 6.6% |
| Scottish | 60.7 /100 | #160 | Good 6.6% |
| Paraguayans | 60.4 /100 | #161 | Good 6.6% |
| Immigrants | Czechoslovakia | 60.2 /100 | #162 | Good 6.6% |
| Immigrants | Middle Africa | 59.4 /100 | #163 | Average 6.6% |
| Greeks | 58.5 /100 | #164 | Average 6.6% |
| English | 58.0 /100 | #165 | Average 6.6% |
| Immigrants | Northern Europe | 57.3 /100 | #166 | Average 6.6% |
| Immigrants | Canada | 55.0 /100 | #167 | Average 6.6% |
| Estonians | 54.8 /100 | #168 | Average 6.6% |