Immigrants from Hong Kong vs Immigrants from Honduras Unemployment Among Ages 65 to 74 years
COMPARE
Immigrants from Hong Kong
Immigrants from Honduras
Unemployment Among Ages 65 to 74 years
Unemployment Among Ages 65 to 74 years Comparison
Immigrants from Hong Kong
Immigrants from Honduras
5.3%
UNEMPLOYMENT AMONG AGES 65 TO 74 YEARS
86.5/ 100
METRIC RATING
128th/ 347
METRIC RANK
5.5%
UNEMPLOYMENT AMONG AGES 65 TO 74 YEARS
10.4/ 100
METRIC RATING
209th/ 347
METRIC RANK
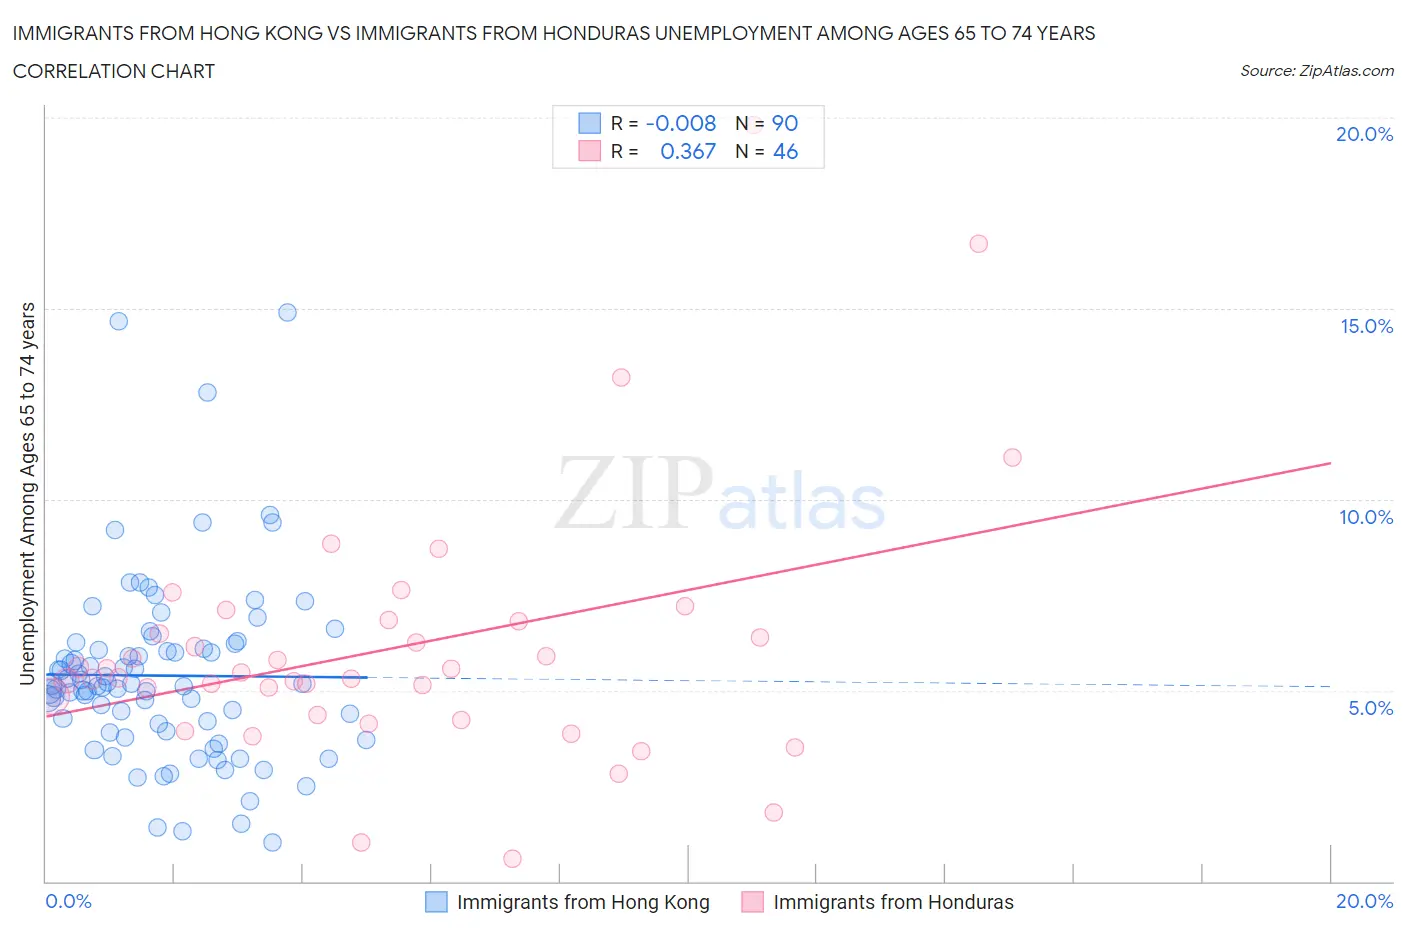
Immigrants from Hong Kong vs Immigrants from Honduras Unemployment Among Ages 65 to 74 years Correlation Chart
The statistical analysis conducted on geographies consisting of 236,925,939 people shows no correlation between the proportion of Immigrants from Hong Kong and unemployment rate among population between the ages 65 and 74 in the United States with a correlation coefficient (R) of -0.008 and weighted average of 5.3%. Similarly, the statistical analysis conducted on geographies consisting of 288,814,870 people shows a mild positive correlation between the proportion of Immigrants from Honduras and unemployment rate among population between the ages 65 and 74 in the United States with a correlation coefficient (R) of 0.367 and weighted average of 5.5%, a difference of 3.4%.
Unemployment Among Ages 65 to 74 years Correlation Summary
| Measurement | Immigrants from Hong Kong | Immigrants from Honduras |
| Minimum | 1.0% | 0.60% |
| Maximum | 14.9% | 19.8% |
| Range | 13.9% | 19.2% |
| Mean | 5.4% | 6.1% |
| Median | 5.1% | 5.4% |
| Interquartile 25% (IQ1) | 3.9% | 4.4% |
| Interquartile 75% (IQ3) | 6.1% | 6.8% |
| Interquartile Range (IQR) | 2.2% | 2.4% |
| Standard Deviation (Sample) | 2.4% | 3.4% |
| Standard Deviation (Population) | 2.4% | 3.4% |
Similar Demographics by Unemployment Among Ages 65 to 74 years
Demographics Similar to Immigrants from Hong Kong by Unemployment Among Ages 65 to 74 years
In terms of unemployment among ages 65 to 74 years, the demographic groups most similar to Immigrants from Hong Kong are Immigrants from North America (5.3%, a difference of 0.010%), Immigrants from England (5.3%, a difference of 0.030%), Immigrants from South Eastern Asia (5.3%, a difference of 0.050%), Pakistani (5.3%, a difference of 0.070%), and Eastern European (5.3%, a difference of 0.070%).
| Demographics | Rating | Rank | Unemployment Among Ages 65 to 74 years |
| Immigrants | Australia | 89.1 /100 | #121 | Excellent 5.3% |
| Immigrants | Canada | 89.0 /100 | #122 | Excellent 5.3% |
| Czechoslovakians | 88.6 /100 | #123 | Excellent 5.3% |
| Immigrants | Ukraine | 87.5 /100 | #124 | Excellent 5.3% |
| Pakistanis | 87.5 /100 | #125 | Excellent 5.3% |
| Immigrants | South Eastern Asia | 87.2 /100 | #126 | Excellent 5.3% |
| Immigrants | North America | 86.7 /100 | #127 | Excellent 5.3% |
| Immigrants | Hong Kong | 86.5 /100 | #128 | Excellent 5.3% |
| Immigrants | England | 86.2 /100 | #129 | Excellent 5.3% |
| Eastern Europeans | 85.6 /100 | #130 | Excellent 5.3% |
| Immigrants | Russia | 83.0 /100 | #131 | Excellent 5.3% |
| Koreans | 82.6 /100 | #132 | Excellent 5.3% |
| Ukrainians | 82.0 /100 | #133 | Excellent 5.3% |
| Immigrants | Panama | 81.8 /100 | #134 | Excellent 5.3% |
| Immigrants | Serbia | 81.8 /100 | #135 | Excellent 5.3% |
Demographics Similar to Immigrants from Honduras by Unemployment Among Ages 65 to 74 years
In terms of unemployment among ages 65 to 74 years, the demographic groups most similar to Immigrants from Honduras are Immigrants from Northern Africa (5.5%, a difference of 0.030%), Dutch West Indian (5.5%, a difference of 0.090%), Immigrants from Croatia (5.5%, a difference of 0.12%), Immigrants from Uzbekistan (5.5%, a difference of 0.17%), and African (5.5%, a difference of 0.20%).
| Demographics | Rating | Rank | Unemployment Among Ages 65 to 74 years |
| Sub-Saharan Africans | 14.4 /100 | #202 | Poor 5.4% |
| Argentineans | 14.3 /100 | #203 | Poor 5.4% |
| Seminole | 14.3 /100 | #204 | Poor 5.4% |
| Icelanders | 14.2 /100 | #205 | Poor 5.4% |
| Africans | 12.8 /100 | #206 | Poor 5.5% |
| Immigrants | Uzbekistan | 12.5 /100 | #207 | Poor 5.5% |
| Dutch West Indians | 11.5 /100 | #208 | Poor 5.5% |
| Immigrants | Honduras | 10.4 /100 | #209 | Poor 5.5% |
| Immigrants | Northern Africa | 10.1 /100 | #210 | Poor 5.5% |
| Immigrants | Croatia | 9.1 /100 | #211 | Tragic 5.5% |
| Haitians | 7.7 /100 | #212 | Tragic 5.5% |
| Italians | 7.7 /100 | #213 | Tragic 5.5% |
| Egyptians | 7.6 /100 | #214 | Tragic 5.5% |
| Americans | 7.3 /100 | #215 | Tragic 5.5% |
| Uruguayans | 6.2 /100 | #216 | Tragic 5.5% |