Immigrants from Guyana vs Immigrants from Grenada Unemployment Among Ages 65 to 74 years
COMPARE
Immigrants from Guyana
Immigrants from Grenada
Unemployment Among Ages 65 to 74 years
Unemployment Among Ages 65 to 74 years Comparison
Immigrants from Guyana
Immigrants from Grenada
5.7%
UNEMPLOYMENT AMONG AGES 65 TO 74 YEARS
0.1/ 100
METRIC RATING
274th/ 347
METRIC RANK
5.8%
UNEMPLOYMENT AMONG AGES 65 TO 74 YEARS
0.0/ 100
METRIC RATING
293rd/ 347
METRIC RANK
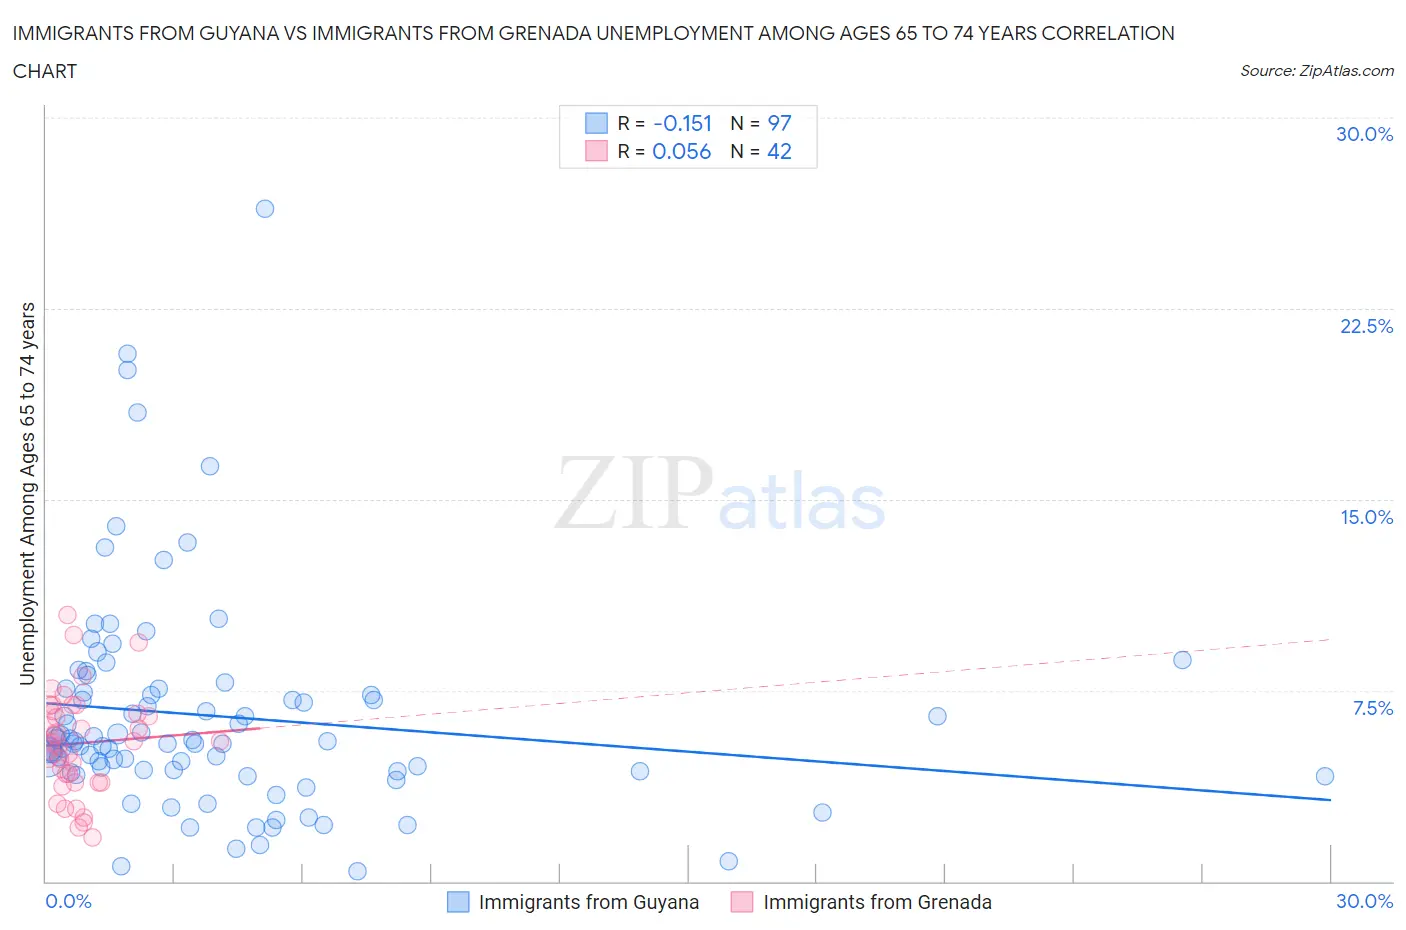
Immigrants from Guyana vs Immigrants from Grenada Unemployment Among Ages 65 to 74 years Correlation Chart
The statistical analysis conducted on geographies consisting of 171,669,228 people shows a poor negative correlation between the proportion of Immigrants from Guyana and unemployment rate among population between the ages 65 and 74 in the United States with a correlation coefficient (R) of -0.151 and weighted average of 5.7%. Similarly, the statistical analysis conducted on geographies consisting of 64,727,355 people shows a slight positive correlation between the proportion of Immigrants from Grenada and unemployment rate among population between the ages 65 and 74 in the United States with a correlation coefficient (R) of 0.056 and weighted average of 5.8%, a difference of 1.8%.
Unemployment Among Ages 65 to 74 years Correlation Summary
| Measurement | Immigrants from Guyana | Immigrants from Grenada |
| Minimum | 0.40% | 1.7% |
| Maximum | 26.4% | 10.5% |
| Range | 26.0% | 8.8% |
| Mean | 6.5% | 5.4% |
| Median | 5.5% | 5.5% |
| Interquartile 25% (IQ1) | 4.3% | 3.9% |
| Interquartile 75% (IQ3) | 7.5% | 6.7% |
| Interquartile Range (IQR) | 3.2% | 2.8% |
| Standard Deviation (Sample) | 4.3% | 2.0% |
| Standard Deviation (Population) | 4.3% | 2.0% |
Demographics Similar to Immigrants from Guyana and Immigrants from Grenada by Unemployment Among Ages 65 to 74 years
In terms of unemployment among ages 65 to 74 years, the demographic groups most similar to Immigrants from Guyana are Bahamian (5.7%, a difference of 0.020%), Immigrants from Liberia (5.7%, a difference of 0.040%), Somali (5.7%, a difference of 0.090%), Immigrants from South America (5.7%, a difference of 0.26%), and Mexican American Indian (5.7%, a difference of 0.28%). Similarly, the demographic groups most similar to Immigrants from Grenada are U.S. Virgin Islander (5.8%, a difference of 0.10%), Portuguese (5.7%, a difference of 0.32%), Spanish American Indian (5.7%, a difference of 0.35%), Immigrants from Somalia (5.7%, a difference of 0.61%), and Central American (5.7%, a difference of 0.62%).
| Demographics | Rating | Rank | Unemployment Among Ages 65 to 74 years |
| Bahamians | 0.1 /100 | #273 | Tragic 5.7% |
| Immigrants | Guyana | 0.1 /100 | #274 | Tragic 5.7% |
| Immigrants | Liberia | 0.1 /100 | #275 | Tragic 5.7% |
| Somalis | 0.1 /100 | #276 | Tragic 5.7% |
| Immigrants | South America | 0.1 /100 | #277 | Tragic 5.7% |
| Mexican American Indians | 0.1 /100 | #278 | Tragic 5.7% |
| Immigrants | Norway | 0.1 /100 | #279 | Tragic 5.7% |
| Moroccans | 0.1 /100 | #280 | Tragic 5.7% |
| Immigrants | West Indies | 0.1 /100 | #281 | Tragic 5.7% |
| Ottawa | 0.1 /100 | #282 | Tragic 5.7% |
| Cypriots | 0.1 /100 | #283 | Tragic 5.7% |
| Chippewa | 0.1 /100 | #284 | Tragic 5.7% |
| Immigrants | Sierra Leone | 0.1 /100 | #285 | Tragic 5.7% |
| Marshallese | 0.1 /100 | #286 | Tragic 5.7% |
| Central American Indians | 0.0 /100 | #287 | Tragic 5.7% |
| Central Americans | 0.0 /100 | #288 | Tragic 5.7% |
| Immigrants | Somalia | 0.0 /100 | #289 | Tragic 5.7% |
| Spanish American Indians | 0.0 /100 | #290 | Tragic 5.7% |
| Portuguese | 0.0 /100 | #291 | Tragic 5.7% |
| U.S. Virgin Islanders | 0.0 /100 | #292 | Tragic 5.8% |
| Immigrants | Grenada | 0.0 /100 | #293 | Tragic 5.8% |