Immigrants from Dominica vs Immigrants from Grenada Unemployment Among Ages 65 to 74 years
COMPARE
Immigrants from Dominica
Immigrants from Grenada
Unemployment Among Ages 65 to 74 years
Unemployment Among Ages 65 to 74 years Comparison
Immigrants from Dominica
Immigrants from Grenada
6.0%
UNEMPLOYMENT AMONG AGES 65 TO 74 YEARS
0.0/ 100
METRIC RATING
321st/ 347
METRIC RANK
5.8%
UNEMPLOYMENT AMONG AGES 65 TO 74 YEARS
0.0/ 100
METRIC RATING
293rd/ 347
METRIC RANK
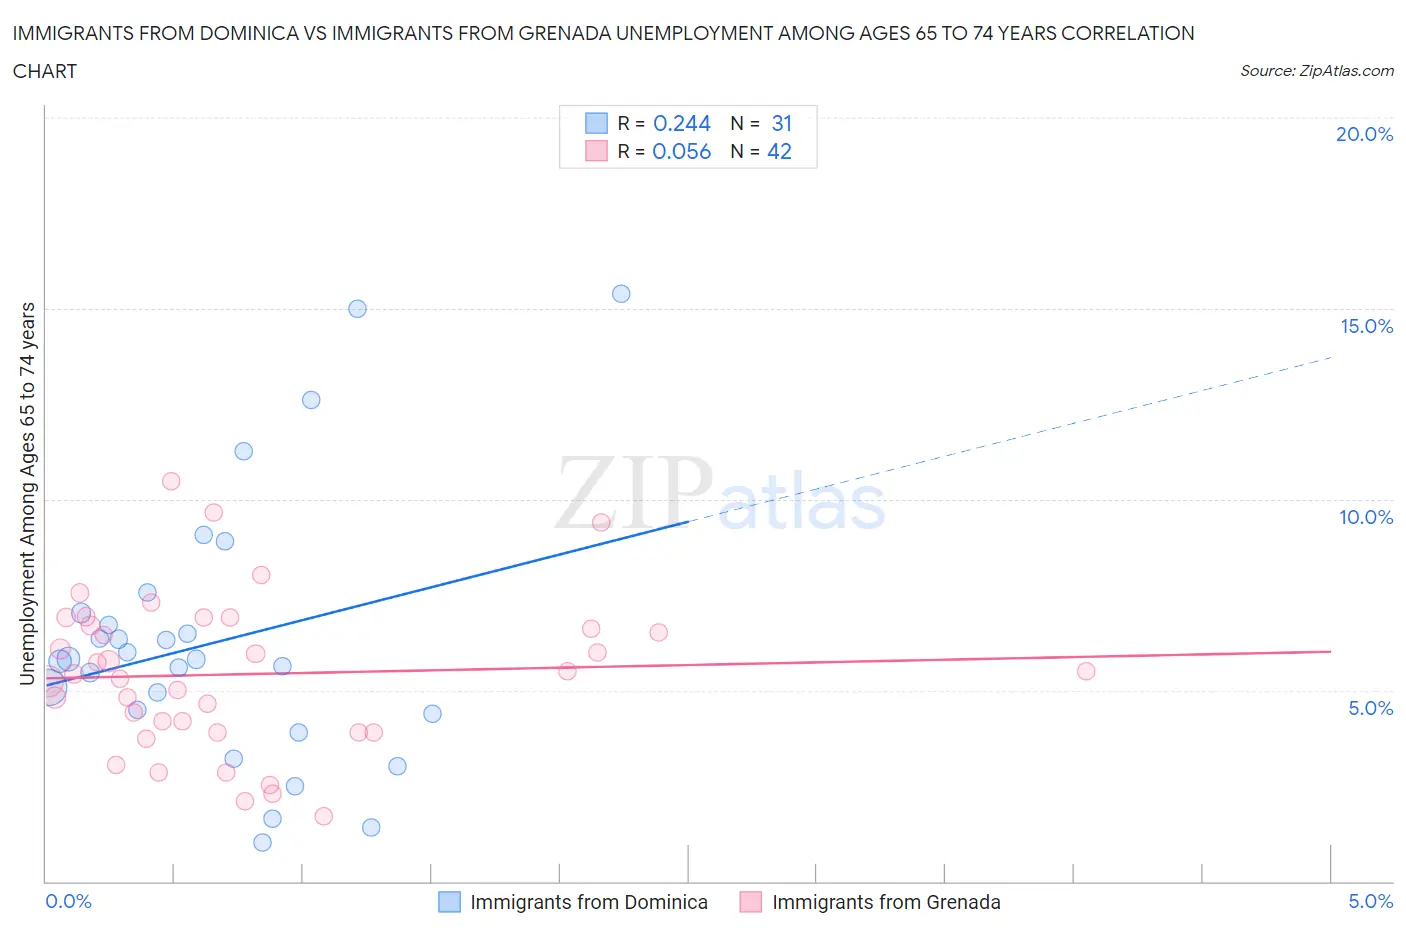
Immigrants from Dominica vs Immigrants from Grenada Unemployment Among Ages 65 to 74 years Correlation Chart
The statistical analysis conducted on geographies consisting of 81,049,854 people shows a weak positive correlation between the proportion of Immigrants from Dominica and unemployment rate among population between the ages 65 and 74 in the United States with a correlation coefficient (R) of 0.244 and weighted average of 6.0%. Similarly, the statistical analysis conducted on geographies consisting of 64,727,355 people shows a slight positive correlation between the proportion of Immigrants from Grenada and unemployment rate among population between the ages 65 and 74 in the United States with a correlation coefficient (R) of 0.056 and weighted average of 5.8%, a difference of 3.5%.
Unemployment Among Ages 65 to 74 years Correlation Summary
| Measurement | Immigrants from Dominica | Immigrants from Grenada |
| Minimum | 1.0% | 1.7% |
| Maximum | 15.4% | 10.5% |
| Range | 14.4% | 8.8% |
| Mean | 6.3% | 5.4% |
| Median | 5.8% | 5.5% |
| Interquartile 25% (IQ1) | 4.4% | 3.9% |
| Interquartile 75% (IQ3) | 7.0% | 6.7% |
| Interquartile Range (IQR) | 2.6% | 2.8% |
| Standard Deviation (Sample) | 3.5% | 2.0% |
| Standard Deviation (Population) | 3.4% | 2.0% |
Similar Demographics by Unemployment Among Ages 65 to 74 years
Demographics Similar to Immigrants from Dominica by Unemployment Among Ages 65 to 74 years
In terms of unemployment among ages 65 to 74 years, the demographic groups most similar to Immigrants from Dominica are Immigrants from Mexico (6.0%, a difference of 0.22%), Delaware (6.0%, a difference of 0.28%), Immigrants from Bahamas (5.9%, a difference of 0.37%), Aleut (5.9%, a difference of 0.46%), and Zimbabwean (5.9%, a difference of 0.49%).
| Demographics | Rating | Rank | Unemployment Among Ages 65 to 74 years |
| Immigrants | Venezuela | 0.0 /100 | #314 | Tragic 5.9% |
| Immigrants | Guatemala | 0.0 /100 | #315 | Tragic 5.9% |
| Immigrants | El Salvador | 0.0 /100 | #316 | Tragic 5.9% |
| Immigrants | Central America | 0.0 /100 | #317 | Tragic 5.9% |
| Zimbabweans | 0.0 /100 | #318 | Tragic 5.9% |
| Aleuts | 0.0 /100 | #319 | Tragic 5.9% |
| Immigrants | Bahamas | 0.0 /100 | #320 | Tragic 5.9% |
| Immigrants | Dominica | 0.0 /100 | #321 | Tragic 6.0% |
| Immigrants | Mexico | 0.0 /100 | #322 | Tragic 6.0% |
| Delaware | 0.0 /100 | #323 | Tragic 6.0% |
| Tohono O'odham | 0.0 /100 | #324 | Tragic 6.0% |
| Immigrants | Portugal | 0.0 /100 | #325 | Tragic 6.0% |
| Natives/Alaskans | 0.0 /100 | #326 | Tragic 6.0% |
| Shoshone | 0.0 /100 | #327 | Tragic 6.2% |
| Immigrants | Azores | 0.0 /100 | #328 | Tragic 6.2% |
Demographics Similar to Immigrants from Grenada by Unemployment Among Ages 65 to 74 years
In terms of unemployment among ages 65 to 74 years, the demographic groups most similar to Immigrants from Grenada are Immigrants from Morocco (5.8%, a difference of 0.030%), Black/African American (5.8%, a difference of 0.060%), U.S. Virgin Islander (5.8%, a difference of 0.10%), Portuguese (5.7%, a difference of 0.32%), and Spanish American Indian (5.7%, a difference of 0.35%).
| Demographics | Rating | Rank | Unemployment Among Ages 65 to 74 years |
| Marshallese | 0.1 /100 | #286 | Tragic 5.7% |
| Central American Indians | 0.0 /100 | #287 | Tragic 5.7% |
| Central Americans | 0.0 /100 | #288 | Tragic 5.7% |
| Immigrants | Somalia | 0.0 /100 | #289 | Tragic 5.7% |
| Spanish American Indians | 0.0 /100 | #290 | Tragic 5.7% |
| Portuguese | 0.0 /100 | #291 | Tragic 5.7% |
| U.S. Virgin Islanders | 0.0 /100 | #292 | Tragic 5.8% |
| Immigrants | Grenada | 0.0 /100 | #293 | Tragic 5.8% |
| Immigrants | Morocco | 0.0 /100 | #294 | Tragic 5.8% |
| Blacks/African Americans | 0.0 /100 | #295 | Tragic 5.8% |
| Pennsylvania Germans | 0.0 /100 | #296 | Tragic 5.8% |
| Houma | 0.0 /100 | #297 | Tragic 5.8% |
| Immigrants | Latin America | 0.0 /100 | #298 | Tragic 5.8% |
| Barbadians | 0.0 /100 | #299 | Tragic 5.8% |
| Ecuadorians | 0.0 /100 | #300 | Tragic 5.8% |