Immigrants from Ghana vs Ottawa Unemployment Among Ages 55 to 59 years
COMPARE
Immigrants from Ghana
Ottawa
Unemployment Among Ages 55 to 59 years
Unemployment Among Ages 55 to 59 years Comparison
Immigrants from Ghana
Ottawa
5.3%
UNEMPLOYMENT AMONG AGES 55 TO 59 YEARS
0.0/ 100
METRIC RATING
286th/ 347
METRIC RANK
5.2%
UNEMPLOYMENT AMONG AGES 55 TO 59 YEARS
0.0/ 100
METRIC RATING
273rd/ 347
METRIC RANK
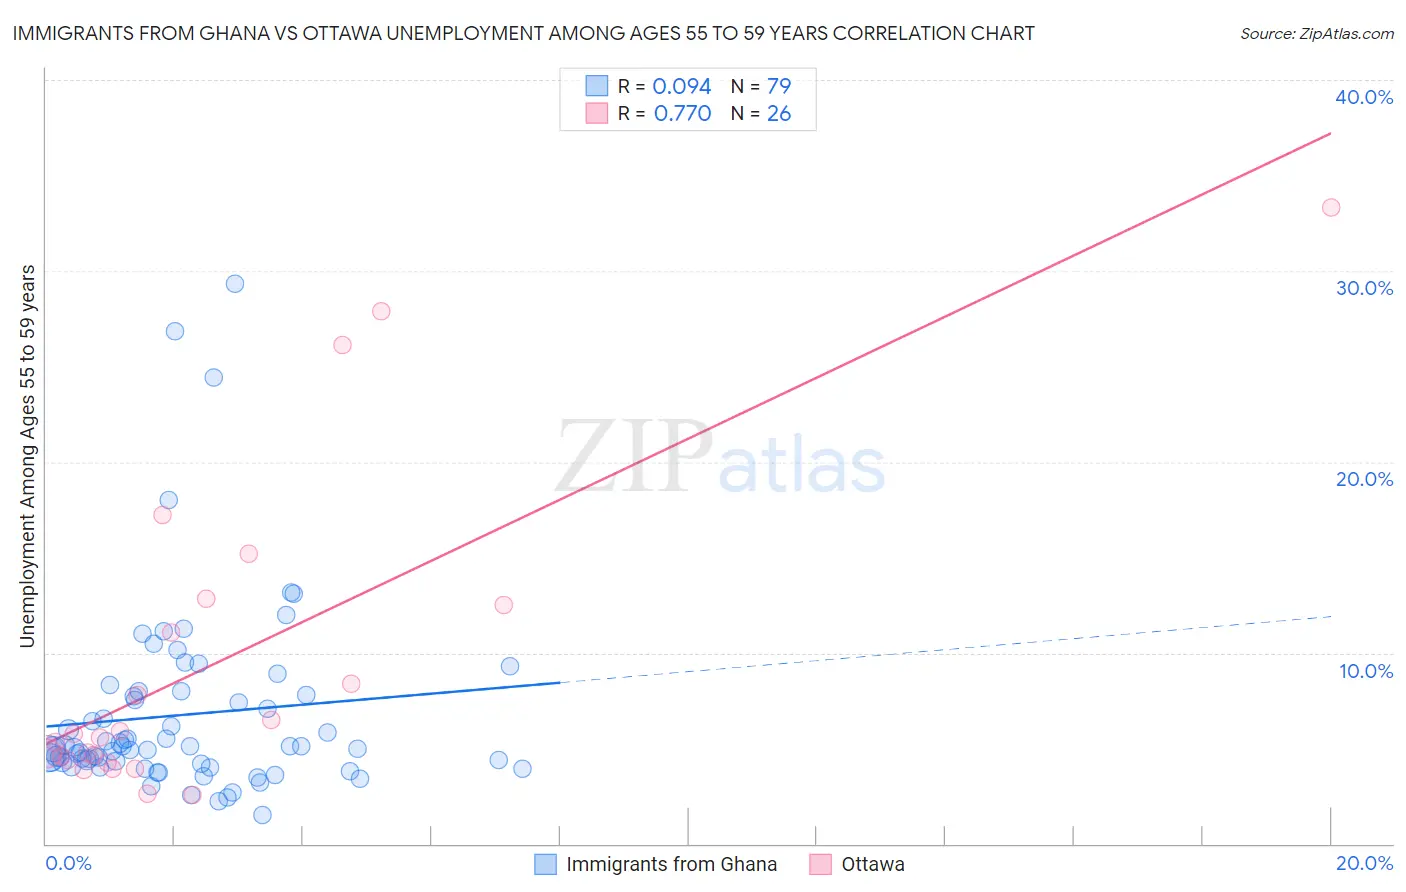
Immigrants from Ghana vs Ottawa Unemployment Among Ages 55 to 59 years Correlation Chart
The statistical analysis conducted on geographies consisting of 192,569,622 people shows a slight positive correlation between the proportion of Immigrants from Ghana and unemployment rate among population between the ages 55 and 59 in the United States with a correlation coefficient (R) of 0.094 and weighted average of 5.3%. Similarly, the statistical analysis conducted on geographies consisting of 48,216,385 people shows a strong positive correlation between the proportion of Ottawa and unemployment rate among population between the ages 55 and 59 in the United States with a correlation coefficient (R) of 0.770 and weighted average of 5.2%, a difference of 1.6%.
Unemployment Among Ages 55 to 59 years Correlation Summary
| Measurement | Immigrants from Ghana | Ottawa |
| Minimum | 1.5% | 2.5% |
| Maximum | 29.3% | 33.3% |
| Range | 27.8% | 30.8% |
| Mean | 6.7% | 9.4% |
| Median | 5.1% | 5.7% |
| Interquartile 25% (IQ1) | 4.2% | 4.4% |
| Interquartile 75% (IQ3) | 7.8% | 12.5% |
| Interquartile Range (IQR) | 3.6% | 8.1% |
| Standard Deviation (Sample) | 5.0% | 8.3% |
| Standard Deviation (Population) | 4.9% | 8.1% |
Demographics Similar to Immigrants from Ghana and Ottawa by Unemployment Among Ages 55 to 59 years
In terms of unemployment among ages 55 to 59 years, the demographic groups most similar to Immigrants from Ghana are Immigrants from Guatemala (5.3%, a difference of 0.020%), Immigrants from Israel (5.3%, a difference of 0.030%), Immigrants from Central America (5.3%, a difference of 0.090%), Armenian (5.3%, a difference of 0.12%), and Ghanaian (5.3%, a difference of 0.22%). Similarly, the demographic groups most similar to Ottawa are Mexican American Indian (5.2%, a difference of 0.12%), Israeli (5.2%, a difference of 0.22%), Immigrants from Jamaica (5.2%, a difference of 0.23%), West Indian (5.2%, a difference of 0.23%), and Immigrants from Latin America (5.2%, a difference of 0.35%).
| Demographics | Rating | Rank | Unemployment Among Ages 55 to 59 years |
| Tsimshian | 0.1 /100 | #269 | Tragic 5.2% |
| Ute | 0.1 /100 | #270 | Tragic 5.2% |
| Cree | 0.1 /100 | #271 | Tragic 5.2% |
| Immigrants | Jamaica | 0.0 /100 | #272 | Tragic 5.2% |
| Ottawa | 0.0 /100 | #273 | Tragic 5.2% |
| Mexican American Indians | 0.0 /100 | #274 | Tragic 5.2% |
| Israelis | 0.0 /100 | #275 | Tragic 5.2% |
| West Indians | 0.0 /100 | #276 | Tragic 5.2% |
| Immigrants | Latin America | 0.0 /100 | #277 | Tragic 5.2% |
| Immigrants | Barbados | 0.0 /100 | #278 | Tragic 5.2% |
| Alsatians | 0.0 /100 | #279 | Tragic 5.2% |
| Immigrants | Uzbekistan | 0.0 /100 | #280 | Tragic 5.3% |
| Guatemalans | 0.0 /100 | #281 | Tragic 5.3% |
| Immigrants | Trinidad and Tobago | 0.0 /100 | #282 | Tragic 5.3% |
| Apache | 0.0 /100 | #283 | Tragic 5.3% |
| Ghanaians | 0.0 /100 | #284 | Tragic 5.3% |
| Armenians | 0.0 /100 | #285 | Tragic 5.3% |
| Immigrants | Ghana | 0.0 /100 | #286 | Tragic 5.3% |
| Immigrants | Guatemala | 0.0 /100 | #287 | Tragic 5.3% |
| Immigrants | Israel | 0.0 /100 | #288 | Tragic 5.3% |
| Immigrants | Central America | 0.0 /100 | #289 | Tragic 5.3% |