Immigrants from Ghana vs Immigrants from Uganda Unemployment Among Ages 55 to 59 years
COMPARE
Immigrants from Ghana
Immigrants from Uganda
Unemployment Among Ages 55 to 59 years
Unemployment Among Ages 55 to 59 years Comparison
Immigrants from Ghana
Immigrants from Uganda
5.3%
UNEMPLOYMENT AMONG AGES 55 TO 59 YEARS
0.0/ 100
METRIC RATING
286th/ 347
METRIC RANK
4.6%
UNEMPLOYMENT AMONG AGES 55 TO 59 YEARS
99.5/ 100
METRIC RATING
59th/ 347
METRIC RANK
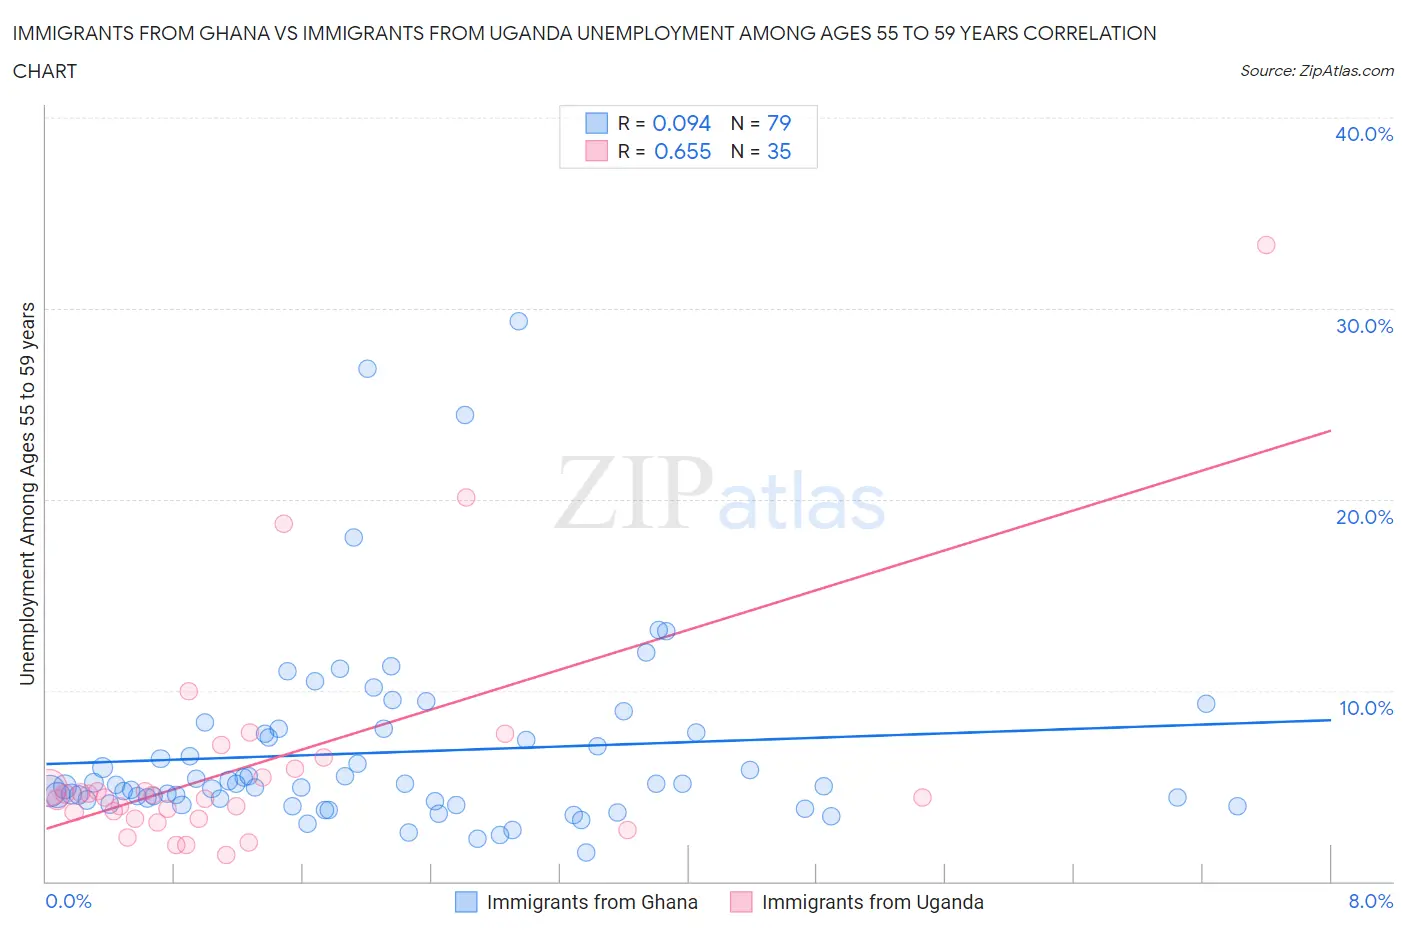
Immigrants from Ghana vs Immigrants from Uganda Unemployment Among Ages 55 to 59 years Correlation Chart
The statistical analysis conducted on geographies consisting of 192,569,622 people shows a slight positive correlation between the proportion of Immigrants from Ghana and unemployment rate among population between the ages 55 and 59 in the United States with a correlation coefficient (R) of 0.094 and weighted average of 5.3%. Similarly, the statistical analysis conducted on geographies consisting of 123,598,960 people shows a significant positive correlation between the proportion of Immigrants from Uganda and unemployment rate among population between the ages 55 and 59 in the United States with a correlation coefficient (R) of 0.655 and weighted average of 4.6%, a difference of 16.1%.
Unemployment Among Ages 55 to 59 years Correlation Summary
| Measurement | Immigrants from Ghana | Immigrants from Uganda |
| Minimum | 1.5% | 1.4% |
| Maximum | 29.3% | 33.3% |
| Range | 27.8% | 31.9% |
| Mean | 6.7% | 6.1% |
| Median | 5.1% | 4.4% |
| Interquartile 25% (IQ1) | 4.2% | 3.3% |
| Interquartile 75% (IQ3) | 7.8% | 5.9% |
| Interquartile Range (IQR) | 3.6% | 2.6% |
| Standard Deviation (Sample) | 5.0% | 6.2% |
| Standard Deviation (Population) | 4.9% | 6.1% |
Similar Demographics by Unemployment Among Ages 55 to 59 years
Demographics Similar to Immigrants from Ghana by Unemployment Among Ages 55 to 59 years
In terms of unemployment among ages 55 to 59 years, the demographic groups most similar to Immigrants from Ghana are Immigrants from Guatemala (5.3%, a difference of 0.020%), Immigrants from Israel (5.3%, a difference of 0.030%), Immigrants from Central America (5.3%, a difference of 0.090%), Armenian (5.3%, a difference of 0.12%), and Sioux (5.3%, a difference of 0.12%).
| Demographics | Rating | Rank | Unemployment Among Ages 55 to 59 years |
| Alsatians | 0.0 /100 | #279 | Tragic 5.2% |
| Immigrants | Uzbekistan | 0.0 /100 | #280 | Tragic 5.3% |
| Guatemalans | 0.0 /100 | #281 | Tragic 5.3% |
| Immigrants | Trinidad and Tobago | 0.0 /100 | #282 | Tragic 5.3% |
| Apache | 0.0 /100 | #283 | Tragic 5.3% |
| Ghanaians | 0.0 /100 | #284 | Tragic 5.3% |
| Armenians | 0.0 /100 | #285 | Tragic 5.3% |
| Immigrants | Ghana | 0.0 /100 | #286 | Tragic 5.3% |
| Immigrants | Guatemala | 0.0 /100 | #287 | Tragic 5.3% |
| Immigrants | Israel | 0.0 /100 | #288 | Tragic 5.3% |
| Immigrants | Central America | 0.0 /100 | #289 | Tragic 5.3% |
| Sioux | 0.0 /100 | #290 | Tragic 5.3% |
| Trinidadians and Tobagonians | 0.0 /100 | #291 | Tragic 5.3% |
| British West Indians | 0.0 /100 | #292 | Tragic 5.3% |
| Immigrants | Grenada | 0.0 /100 | #293 | Tragic 5.3% |
Demographics Similar to Immigrants from Uganda by Unemployment Among Ages 55 to 59 years
In terms of unemployment among ages 55 to 59 years, the demographic groups most similar to Immigrants from Uganda are Dutch (4.6%, a difference of 0.050%), Immigrants from Argentina (4.6%, a difference of 0.13%), Okinawan (4.5%, a difference of 0.23%), Northern European (4.5%, a difference of 0.24%), and Welsh (4.5%, a difference of 0.25%).
| Demographics | Rating | Rank | Unemployment Among Ages 55 to 59 years |
| Scottish | 99.7 /100 | #52 | Exceptional 4.5% |
| Immigrants | Middle Africa | 99.7 /100 | #53 | Exceptional 4.5% |
| Burmese | 99.7 /100 | #54 | Exceptional 4.5% |
| Immigrants | Nepal | 99.6 /100 | #55 | Exceptional 4.5% |
| Welsh | 99.6 /100 | #56 | Exceptional 4.5% |
| Northern Europeans | 99.6 /100 | #57 | Exceptional 4.5% |
| Okinawans | 99.6 /100 | #58 | Exceptional 4.5% |
| Immigrants | Uganda | 99.5 /100 | #59 | Exceptional 4.6% |
| Dutch | 99.5 /100 | #60 | Exceptional 4.6% |
| Immigrants | Argentina | 99.5 /100 | #61 | Exceptional 4.6% |
| Slovenes | 99.3 /100 | #62 | Exceptional 4.6% |
| Immigrants | South Central Asia | 99.3 /100 | #63 | Exceptional 4.6% |
| Argentineans | 99.1 /100 | #64 | Exceptional 4.6% |
| Sudanese | 99.1 /100 | #65 | Exceptional 4.6% |
| Mongolians | 99.0 /100 | #66 | Exceptional 4.6% |