Immigrants from Germany vs Indian (Asian) Unemployment Among Ages 16 to 19 years
COMPARE
Immigrants from Germany
Indian (Asian)
Unemployment Among Ages 16 to 19 years
Unemployment Among Ages 16 to 19 years Comparison
Immigrants from Germany
Indians (Asian)
17.2%
UNEMPLOYMENT AMONG AGES 16 TO 19 YEARS
87.7/ 100
METRIC RATING
125th/ 347
METRIC RANK
17.3%
UNEMPLOYMENT AMONG AGES 16 TO 19 YEARS
77.6/ 100
METRIC RATING
145th/ 347
METRIC RANK
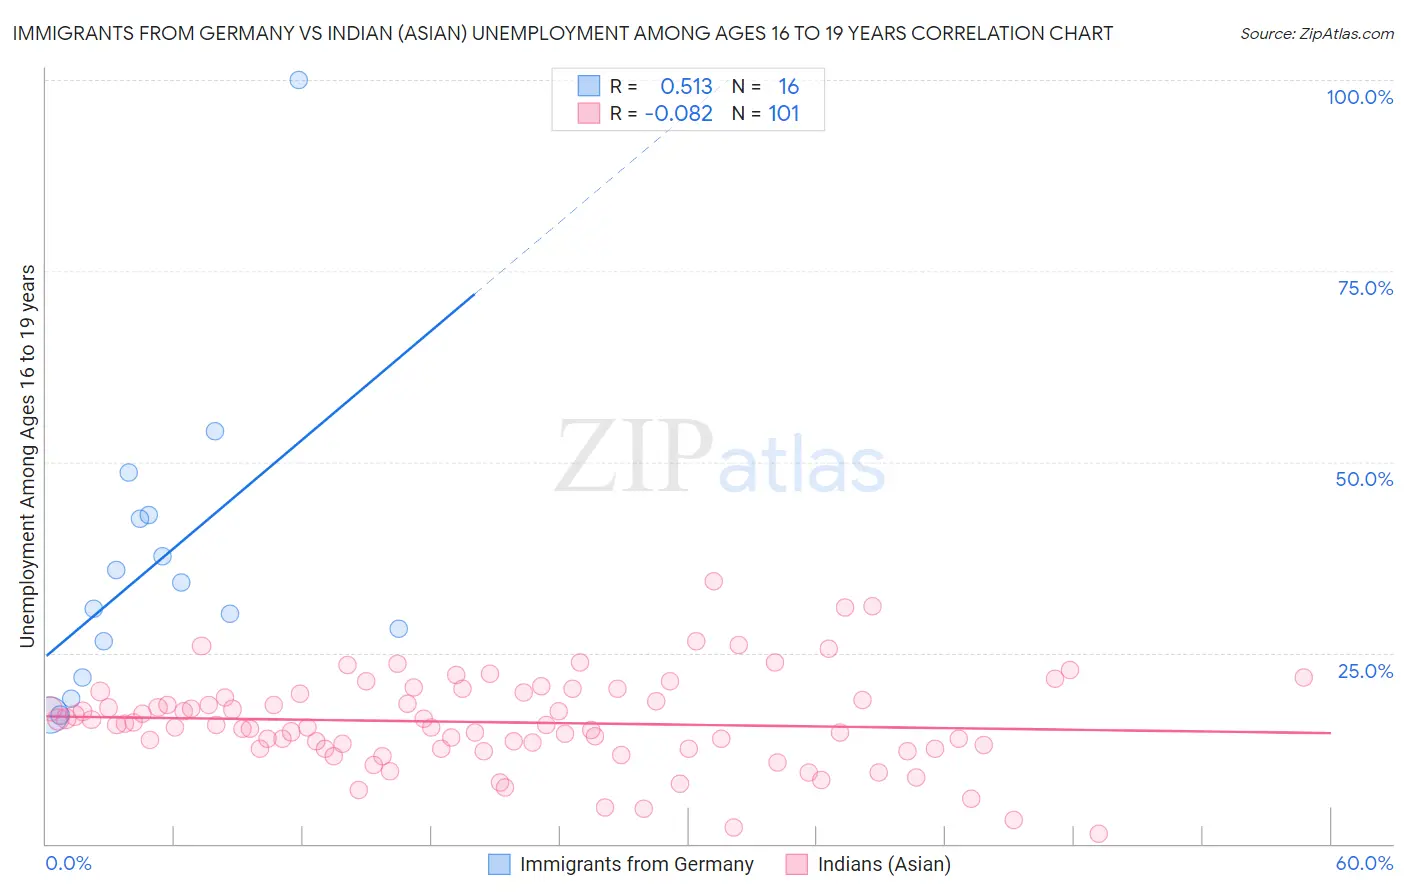
Immigrants from Germany vs Indian (Asian) Unemployment Among Ages 16 to 19 years Correlation Chart
The statistical analysis conducted on geographies consisting of 432,593,145 people shows a substantial positive correlation between the proportion of Immigrants from Germany and unemployment rate among population between the ages 16 and 19 in the United States with a correlation coefficient (R) of 0.513 and weighted average of 17.2%. Similarly, the statistical analysis conducted on geographies consisting of 460,680,068 people shows a slight negative correlation between the proportion of Indians (Asian) and unemployment rate among population between the ages 16 and 19 in the United States with a correlation coefficient (R) of -0.082 and weighted average of 17.3%, a difference of 0.87%.
Unemployment Among Ages 16 to 19 years Correlation Summary
| Measurement | Immigrants from Germany | Indian (Asian) |
| Minimum | 16.9% | 1.3% |
| Maximum | 100.0% | 34.3% |
| Range | 83.1% | 33.0% |
| Mean | 36.6% | 15.9% |
| Median | 32.5% | 15.6% |
| Interquartile 25% (IQ1) | 24.1% | 12.4% |
| Interquartile 75% (IQ3) | 42.8% | 19.7% |
| Interquartile Range (IQR) | 18.7% | 7.3% |
| Standard Deviation (Sample) | 20.2% | 6.0% |
| Standard Deviation (Population) | 19.5% | 6.0% |
Demographics Similar to Immigrants from Germany and Indians (Asian) by Unemployment Among Ages 16 to 19 years
In terms of unemployment among ages 16 to 19 years, the demographic groups most similar to Immigrants from Germany are Immigrants from Bolivia (17.2%, a difference of 0.10%), Pakistani (17.2%, a difference of 0.20%), Australian (17.2%, a difference of 0.22%), Creek (17.2%, a difference of 0.23%), and Immigrants from Indonesia (17.2%, a difference of 0.31%). Similarly, the demographic groups most similar to Indians (Asian) are Immigrants from England (17.3%, a difference of 0.090%), Immigrants from Egypt (17.3%, a difference of 0.10%), Spanish (17.3%, a difference of 0.12%), Basque (17.3%, a difference of 0.22%), and Immigrants from Croatia (17.3%, a difference of 0.23%).
| Demographics | Rating | Rank | Unemployment Among Ages 16 to 19 years |
| Immigrants | Germany | 87.7 /100 | #125 | Excellent 17.2% |
| Immigrants | Bolivia | 86.7 /100 | #126 | Excellent 17.2% |
| Pakistanis | 85.8 /100 | #127 | Excellent 17.2% |
| Australians | 85.6 /100 | #128 | Excellent 17.2% |
| Creek | 85.5 /100 | #129 | Excellent 17.2% |
| Immigrants | Indonesia | 84.7 /100 | #130 | Excellent 17.2% |
| German Russians | 84.1 /100 | #131 | Excellent 17.2% |
| Arabs | 83.9 /100 | #132 | Excellent 17.2% |
| Laotians | 83.9 /100 | #133 | Excellent 17.2% |
| Potawatomi | 83.8 /100 | #134 | Excellent 17.2% |
| Samoans | 83.7 /100 | #135 | Excellent 17.2% |
| Immigrants | Oceania | 83.1 /100 | #136 | Excellent 17.2% |
| Immigrants | Malaysia | 82.8 /100 | #137 | Excellent 17.2% |
| Bolivians | 81.9 /100 | #138 | Excellent 17.3% |
| Immigrants | Eritrea | 81.1 /100 | #139 | Excellent 17.3% |
| Immigrants | Croatia | 80.8 /100 | #140 | Excellent 17.3% |
| Basques | 80.7 /100 | #141 | Excellent 17.3% |
| Spanish | 79.3 /100 | #142 | Good 17.3% |
| Immigrants | Egypt | 79.1 /100 | #143 | Good 17.3% |
| Immigrants | England | 78.9 /100 | #144 | Good 17.3% |
| Indians (Asian) | 77.6 /100 | #145 | Good 17.3% |