French American Indian vs Indian (Asian) Unemployment Among Ages 16 to 19 years
COMPARE
French American Indian
Indian (Asian)
Unemployment Among Ages 16 to 19 years
Unemployment Among Ages 16 to 19 years Comparison
French American Indians
Indians (Asian)
18.3%
UNEMPLOYMENT AMONG AGES 16 TO 19 YEARS
2.9/ 100
METRIC RATING
235th/ 347
METRIC RANK
17.3%
UNEMPLOYMENT AMONG AGES 16 TO 19 YEARS
77.6/ 100
METRIC RATING
145th/ 347
METRIC RANK
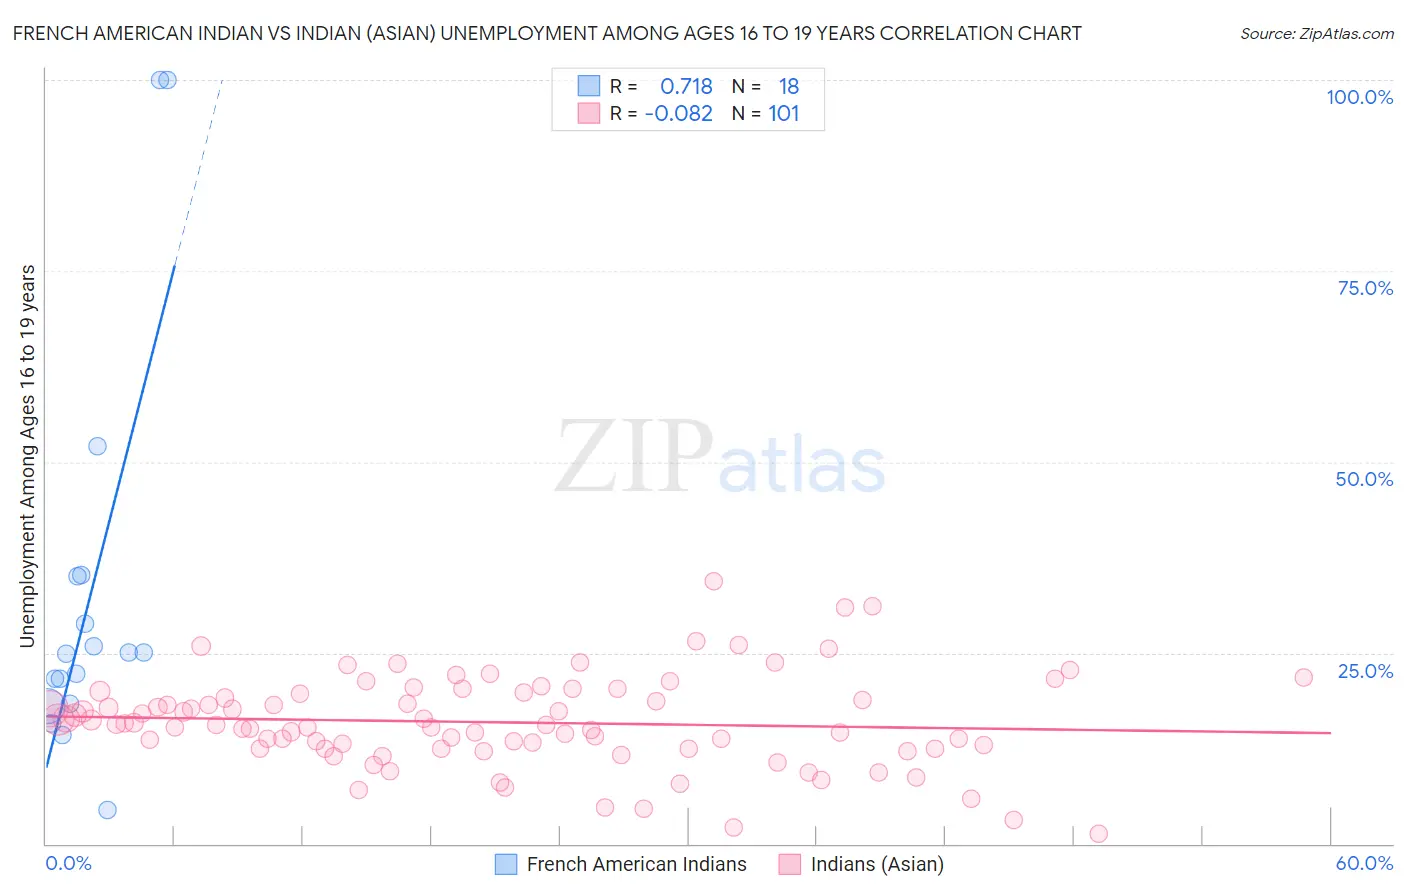
French American Indian vs Indian (Asian) Unemployment Among Ages 16 to 19 years Correlation Chart
The statistical analysis conducted on geographies consisting of 128,184,949 people shows a strong positive correlation between the proportion of French American Indians and unemployment rate among population between the ages 16 and 19 in the United States with a correlation coefficient (R) of 0.718 and weighted average of 18.3%. Similarly, the statistical analysis conducted on geographies consisting of 460,680,068 people shows a slight negative correlation between the proportion of Indians (Asian) and unemployment rate among population between the ages 16 and 19 in the United States with a correlation coefficient (R) of -0.082 and weighted average of 17.3%, a difference of 5.7%.
Unemployment Among Ages 16 to 19 years Correlation Summary
| Measurement | French American Indian | Indian (Asian) |
| Minimum | 4.5% | 1.3% |
| Maximum | 100.0% | 34.3% |
| Range | 95.5% | 33.0% |
| Mean | 32.7% | 15.9% |
| Median | 25.0% | 15.6% |
| Interquartile 25% (IQ1) | 18.3% | 12.4% |
| Interquartile 75% (IQ3) | 35.1% | 19.7% |
| Interquartile Range (IQR) | 16.8% | 7.3% |
| Standard Deviation (Sample) | 26.4% | 6.0% |
| Standard Deviation (Population) | 25.7% | 6.0% |
Similar Demographics by Unemployment Among Ages 16 to 19 years
Demographics Similar to French American Indians by Unemployment Among Ages 16 to 19 years
In terms of unemployment among ages 16 to 19 years, the demographic groups most similar to French American Indians are Immigrants from Colombia (18.3%, a difference of 0.070%), Immigrants (18.3%, a difference of 0.090%), South American (18.3%, a difference of 0.10%), Native Hawaiian (18.3%, a difference of 0.19%), and Colombian (18.3%, a difference of 0.29%).
| Demographics | Rating | Rank | Unemployment Among Ages 16 to 19 years |
| Immigrants | Greece | 7.1 /100 | #228 | Tragic 18.1% |
| Albanians | 5.8 /100 | #229 | Tragic 18.2% |
| Spanish Americans | 4.7 /100 | #230 | Tragic 18.2% |
| Nepalese | 4.2 /100 | #231 | Tragic 18.2% |
| Immigrants | Russia | 4.0 /100 | #232 | Tragic 18.2% |
| Seminole | 4.0 /100 | #233 | Tragic 18.2% |
| Colombians | 3.7 /100 | #234 | Tragic 18.3% |
| French American Indians | 2.9 /100 | #235 | Tragic 18.3% |
| Immigrants | Colombia | 2.7 /100 | #236 | Tragic 18.3% |
| Immigrants | Immigrants | 2.7 /100 | #237 | Tragic 18.3% |
| South Americans | 2.6 /100 | #238 | Tragic 18.3% |
| Native Hawaiians | 2.4 /100 | #239 | Tragic 18.3% |
| Immigrants | Cabo Verde | 2.0 /100 | #240 | Tragic 18.4% |
| Immigrants | Ukraine | 1.3 /100 | #241 | Tragic 18.5% |
| Moroccans | 1.1 /100 | #242 | Tragic 18.5% |
Demographics Similar to Indians (Asian) by Unemployment Among Ages 16 to 19 years
In terms of unemployment among ages 16 to 19 years, the demographic groups most similar to Indians (Asian) are Turkish (17.3%, a difference of 0.040%), Immigrants from England (17.3%, a difference of 0.090%), Immigrants from Egypt (17.3%, a difference of 0.10%), Tsimshian (17.3%, a difference of 0.11%), and Spanish (17.3%, a difference of 0.12%).
| Demographics | Rating | Rank | Unemployment Among Ages 16 to 19 years |
| Bolivians | 81.9 /100 | #138 | Excellent 17.3% |
| Immigrants | Eritrea | 81.1 /100 | #139 | Excellent 17.3% |
| Immigrants | Croatia | 80.8 /100 | #140 | Excellent 17.3% |
| Basques | 80.7 /100 | #141 | Excellent 17.3% |
| Spanish | 79.3 /100 | #142 | Good 17.3% |
| Immigrants | Egypt | 79.1 /100 | #143 | Good 17.3% |
| Immigrants | England | 78.9 /100 | #144 | Good 17.3% |
| Indians (Asian) | 77.6 /100 | #145 | Good 17.3% |
| Turks | 77.1 /100 | #146 | Good 17.3% |
| Tsimshian | 76.0 /100 | #147 | Good 17.3% |
| Romanians | 74.9 /100 | #148 | Good 17.3% |
| Immigrants | Eastern Asia | 73.8 /100 | #149 | Good 17.4% |
| Immigrants | Northern Europe | 72.5 /100 | #150 | Good 17.4% |
| Immigrants | Hong Kong | 69.3 /100 | #151 | Good 17.4% |
| Immigrants | Northern Africa | 69.0 /100 | #152 | Good 17.4% |