Immigrants from Germany vs Immigrants from Croatia Unemployment Among Ages 20 to 24 years
COMPARE
Immigrants from Germany
Immigrants from Croatia
Unemployment Among Ages 20 to 24 years
Unemployment Among Ages 20 to 24 years Comparison
Immigrants from Germany
Immigrants from Croatia
10.4%
UNEMPLOYMENT AMONG AGES 20 TO 24 YEARS
38.1/ 100
METRIC RATING
182nd/ 347
METRIC RANK
9.9%
UNEMPLOYMENT AMONG AGES 20 TO 24 YEARS
99.0/ 100
METRIC RATING
70th/ 347
METRIC RANK
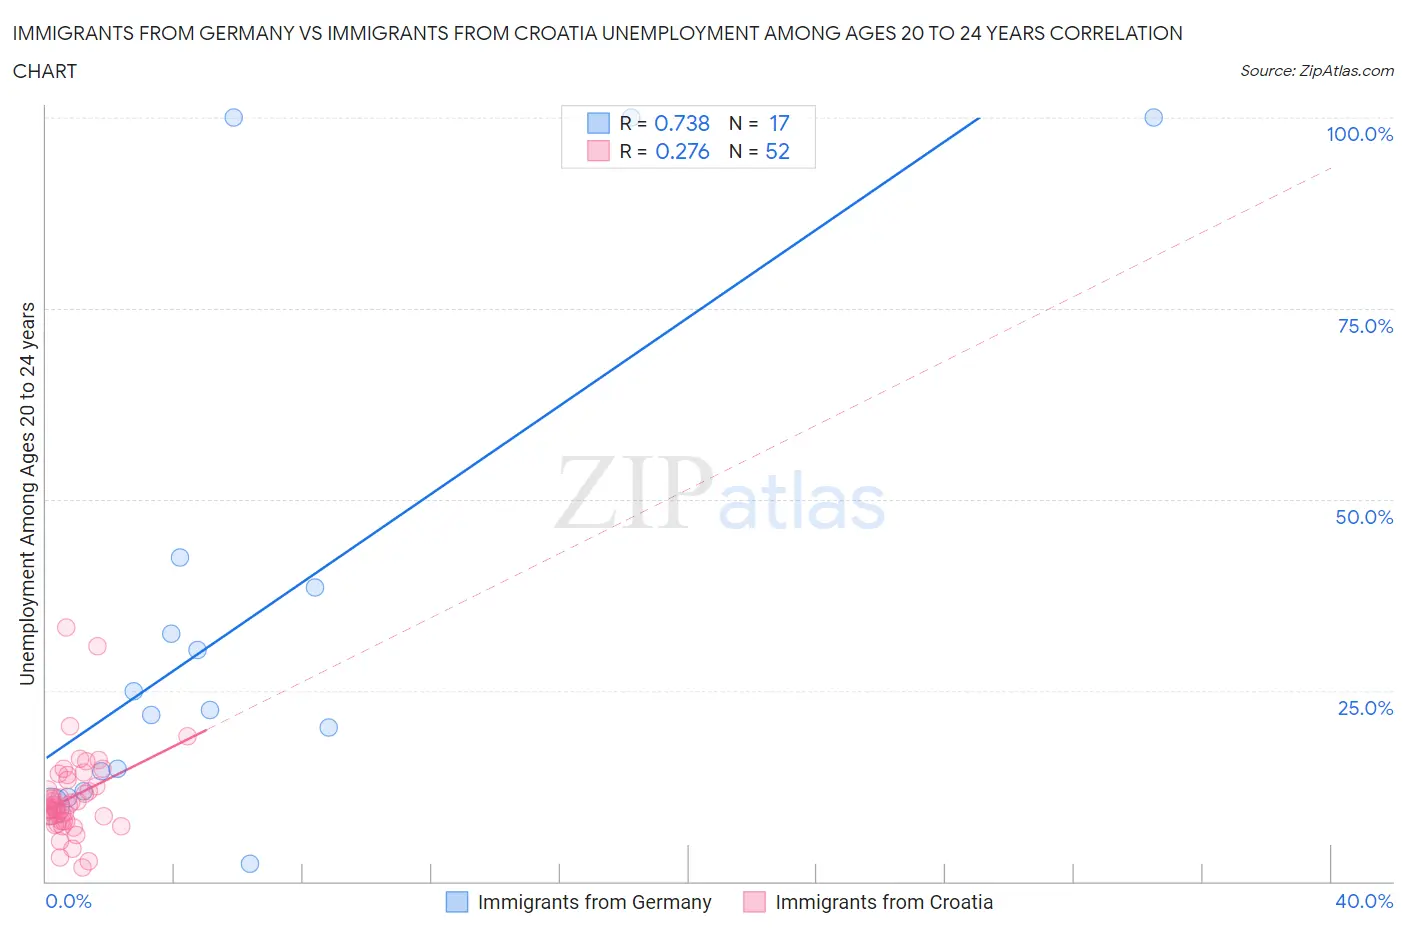
Immigrants from Germany vs Immigrants from Croatia Unemployment Among Ages 20 to 24 years Correlation Chart
The statistical analysis conducted on geographies consisting of 442,881,118 people shows a strong positive correlation between the proportion of Immigrants from Germany and unemployment rate among population between the ages 20 and 24 in the United States with a correlation coefficient (R) of 0.738 and weighted average of 10.4%. Similarly, the statistical analysis conducted on geographies consisting of 130,896,610 people shows a weak positive correlation between the proportion of Immigrants from Croatia and unemployment rate among population between the ages 20 and 24 in the United States with a correlation coefficient (R) of 0.276 and weighted average of 9.9%, a difference of 4.8%.
Unemployment Among Ages 20 to 24 years Correlation Summary
| Measurement | Immigrants from Germany | Immigrants from Croatia |
| Minimum | 2.3% | 1.8% |
| Maximum | 100.0% | 33.2% |
| Range | 97.7% | 31.4% |
| Mean | 35.1% | 11.0% |
| Median | 22.4% | 9.7% |
| Interquartile 25% (IQ1) | 13.1% | 7.9% |
| Interquartile 75% (IQ3) | 40.4% | 12.9% |
| Interquartile Range (IQR) | 27.3% | 5.0% |
| Standard Deviation (Sample) | 32.7% | 5.7% |
| Standard Deviation (Population) | 31.7% | 5.6% |
Similar Demographics by Unemployment Among Ages 20 to 24 years
Demographics Similar to Immigrants from Germany by Unemployment Among Ages 20 to 24 years
In terms of unemployment among ages 20 to 24 years, the demographic groups most similar to Immigrants from Germany are Immigrants from Egypt (10.4%, a difference of 0.030%), Okinawan (10.3%, a difference of 0.040%), Greek (10.4%, a difference of 0.040%), Immigrants from Turkey (10.3%, a difference of 0.050%), and Tlingit-Haida (10.3%, a difference of 0.060%).
| Demographics | Rating | Rank | Unemployment Among Ages 20 to 24 years |
| Samoans | 45.4 /100 | #175 | Average 10.3% |
| Potawatomi | 42.0 /100 | #176 | Average 10.3% |
| Immigrants | Czechoslovakia | 40.8 /100 | #177 | Average 10.3% |
| Alsatians | 40.5 /100 | #178 | Average 10.3% |
| Tlingit-Haida | 39.7 /100 | #179 | Fair 10.3% |
| Immigrants | Turkey | 39.3 /100 | #180 | Fair 10.3% |
| Okinawans | 39.1 /100 | #181 | Fair 10.3% |
| Immigrants | Germany | 38.1 /100 | #182 | Fair 10.4% |
| Immigrants | Egypt | 37.4 /100 | #183 | Fair 10.4% |
| Greeks | 37.2 /100 | #184 | Fair 10.4% |
| Syrians | 35.6 /100 | #185 | Fair 10.4% |
| Guamanians/Chamorros | 35.4 /100 | #186 | Fair 10.4% |
| Immigrants | Western Europe | 35.0 /100 | #187 | Fair 10.4% |
| Immigrants | Russia | 34.6 /100 | #188 | Fair 10.4% |
| Hawaiians | 33.9 /100 | #189 | Fair 10.4% |
Demographics Similar to Immigrants from Croatia by Unemployment Among Ages 20 to 24 years
In terms of unemployment among ages 20 to 24 years, the demographic groups most similar to Immigrants from Croatia are Celtic (9.9%, a difference of 0.030%), Bolivian (9.9%, a difference of 0.070%), Bulgarian (9.9%, a difference of 0.12%), Mongolian (9.9%, a difference of 0.20%), and Kenyan (9.9%, a difference of 0.21%).
| Demographics | Rating | Rank | Unemployment Among Ages 20 to 24 years |
| British | 99.4 /100 | #63 | Exceptional 9.8% |
| Serbians | 99.4 /100 | #64 | Exceptional 9.8% |
| Welsh | 99.3 /100 | #65 | Exceptional 9.8% |
| Scottish | 99.3 /100 | #66 | Exceptional 9.8% |
| Immigrants | Bolivia | 99.2 /100 | #67 | Exceptional 9.9% |
| Mongolians | 99.1 /100 | #68 | Exceptional 9.9% |
| Bulgarians | 99.1 /100 | #69 | Exceptional 9.9% |
| Immigrants | Croatia | 99.0 /100 | #70 | Exceptional 9.9% |
| Celtics | 98.9 /100 | #71 | Exceptional 9.9% |
| Bolivians | 98.9 /100 | #72 | Exceptional 9.9% |
| Kenyans | 98.7 /100 | #73 | Exceptional 9.9% |
| Immigrants | Laos | 98.7 /100 | #74 | Exceptional 9.9% |
| Immigrants | Australia | 98.6 /100 | #75 | Exceptional 9.9% |
| Czechoslovakians | 98.4 /100 | #76 | Exceptional 9.9% |
| Chickasaw | 98.4 /100 | #77 | Exceptional 9.9% |