American vs Immigrants from Croatia Unemployment Among Ages 20 to 24 years
COMPARE
American
Immigrants from Croatia
Unemployment Among Ages 20 to 24 years
Unemployment Among Ages 20 to 24 years Comparison
Americans
Immigrants from Croatia
10.6%
UNEMPLOYMENT AMONG AGES 20 TO 24 YEARS
4.4/ 100
METRIC RATING
229th/ 347
METRIC RANK
9.9%
UNEMPLOYMENT AMONG AGES 20 TO 24 YEARS
99.0/ 100
METRIC RATING
70th/ 347
METRIC RANK
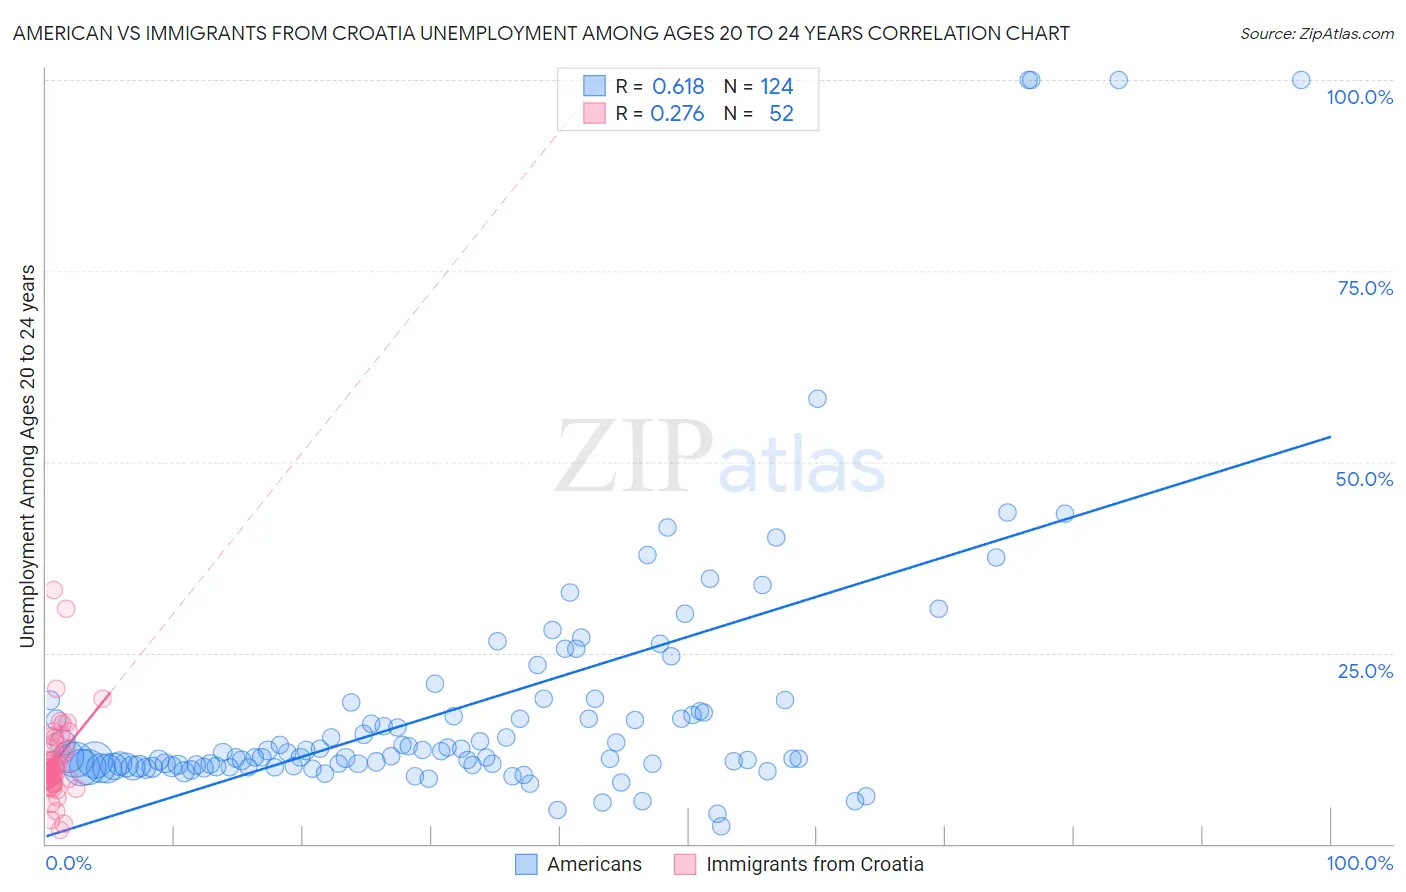
American vs Immigrants from Croatia Unemployment Among Ages 20 to 24 years Correlation Chart
The statistical analysis conducted on geographies consisting of 529,663,619 people shows a significant positive correlation between the proportion of Americans and unemployment rate among population between the ages 20 and 24 in the United States with a correlation coefficient (R) of 0.618 and weighted average of 10.6%. Similarly, the statistical analysis conducted on geographies consisting of 130,896,610 people shows a weak positive correlation between the proportion of Immigrants from Croatia and unemployment rate among population between the ages 20 and 24 in the United States with a correlation coefficient (R) of 0.276 and weighted average of 9.9%, a difference of 7.3%.
Unemployment Among Ages 20 to 24 years Correlation Summary
| Measurement | American | Immigrants from Croatia |
| Minimum | 2.4% | 1.8% |
| Maximum | 100.0% | 33.2% |
| Range | 97.6% | 31.4% |
| Mean | 18.0% | 11.0% |
| Median | 11.4% | 9.7% |
| Interquartile 25% (IQ1) | 10.1% | 7.9% |
| Interquartile 75% (IQ3) | 17.3% | 12.9% |
| Interquartile Range (IQR) | 7.2% | 5.0% |
| Standard Deviation (Sample) | 17.7% | 5.7% |
| Standard Deviation (Population) | 17.6% | 5.6% |
Similar Demographics by Unemployment Among Ages 20 to 24 years
Demographics Similar to Americans by Unemployment Among Ages 20 to 24 years
In terms of unemployment among ages 20 to 24 years, the demographic groups most similar to Americans are Mexican American Indian (10.6%, a difference of 0.040%), French American Indian (10.6%, a difference of 0.060%), Immigrants from Costa Rica (10.6%, a difference of 0.11%), Palestinian (10.6%, a difference of 0.11%), and Native Hawaiian (10.6%, a difference of 0.11%).
| Demographics | Rating | Rank | Unemployment Among Ages 20 to 24 years |
| Immigrants | Poland | 6.4 /100 | #222 | Tragic 10.6% |
| Arabs | 5.6 /100 | #223 | Tragic 10.6% |
| Nepalese | 5.1 /100 | #224 | Tragic 10.6% |
| Immigrants | South America | 5.1 /100 | #225 | Tragic 10.6% |
| Immigrants | Costa Rica | 4.9 /100 | #226 | Tragic 10.6% |
| Palestinians | 4.9 /100 | #227 | Tragic 10.6% |
| Mexican American Indians | 4.6 /100 | #228 | Tragic 10.6% |
| Americans | 4.4 /100 | #229 | Tragic 10.6% |
| French American Indians | 4.1 /100 | #230 | Tragic 10.6% |
| Native Hawaiians | 3.9 /100 | #231 | Tragic 10.6% |
| Israelis | 3.7 /100 | #232 | Tragic 10.6% |
| Choctaw | 3.6 /100 | #233 | Tragic 10.6% |
| Immigrants | Africa | 3.5 /100 | #234 | Tragic 10.6% |
| Immigrants | Ukraine | 3.3 /100 | #235 | Tragic 10.6% |
| Mexicans | 3.2 /100 | #236 | Tragic 10.6% |
Demographics Similar to Immigrants from Croatia by Unemployment Among Ages 20 to 24 years
In terms of unemployment among ages 20 to 24 years, the demographic groups most similar to Immigrants from Croatia are Celtic (9.9%, a difference of 0.030%), Bolivian (9.9%, a difference of 0.070%), Bulgarian (9.9%, a difference of 0.12%), Mongolian (9.9%, a difference of 0.20%), and Kenyan (9.9%, a difference of 0.21%).
| Demographics | Rating | Rank | Unemployment Among Ages 20 to 24 years |
| British | 99.4 /100 | #63 | Exceptional 9.8% |
| Serbians | 99.4 /100 | #64 | Exceptional 9.8% |
| Welsh | 99.3 /100 | #65 | Exceptional 9.8% |
| Scottish | 99.3 /100 | #66 | Exceptional 9.8% |
| Immigrants | Bolivia | 99.2 /100 | #67 | Exceptional 9.9% |
| Mongolians | 99.1 /100 | #68 | Exceptional 9.9% |
| Bulgarians | 99.1 /100 | #69 | Exceptional 9.9% |
| Immigrants | Croatia | 99.0 /100 | #70 | Exceptional 9.9% |
| Celtics | 98.9 /100 | #71 | Exceptional 9.9% |
| Bolivians | 98.9 /100 | #72 | Exceptional 9.9% |
| Kenyans | 98.7 /100 | #73 | Exceptional 9.9% |
| Immigrants | Laos | 98.7 /100 | #74 | Exceptional 9.9% |
| Immigrants | Australia | 98.6 /100 | #75 | Exceptional 9.9% |
| Czechoslovakians | 98.4 /100 | #76 | Exceptional 9.9% |
| Chickasaw | 98.4 /100 | #77 | Exceptional 9.9% |