Immigrants from Eritrea vs Immigrants from Belize Unemployment Among Women with Children Ages 6 to 17 years
COMPARE
Immigrants from Eritrea
Immigrants from Belize
Unemployment Among Women with Children Ages 6 to 17 years
Unemployment Among Women with Children Ages 6 to 17 years Comparison
Immigrants from Eritrea
Immigrants from Belize
9.2%
UNEMPLOYMENT AMONG WOMEN WITH CHILDREN AGES 6 TO 17 YEARS
5.8/ 100
METRIC RATING
223rd/ 347
METRIC RANK
9.3%
UNEMPLOYMENT AMONG WOMEN WITH CHILDREN AGES 6 TO 17 YEARS
2.8/ 100
METRIC RATING
237th/ 347
METRIC RANK
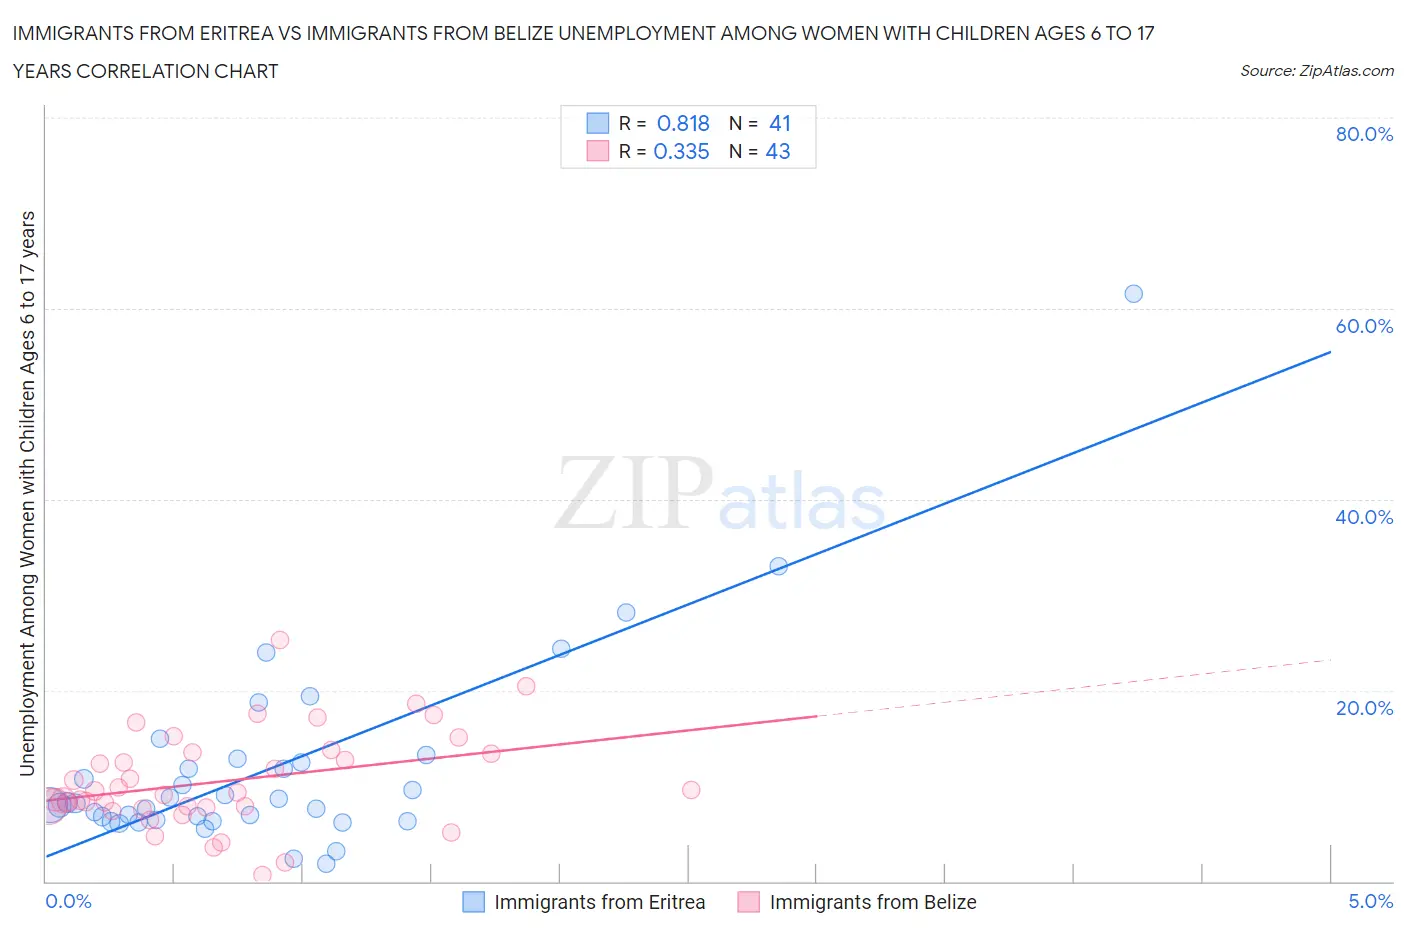
Immigrants from Eritrea vs Immigrants from Belize Unemployment Among Women with Children Ages 6 to 17 years Correlation Chart
The statistical analysis conducted on geographies consisting of 94,079,249 people shows a very strong positive correlation between the proportion of Immigrants from Eritrea and unemployment rate among women with children between the ages 6 and 17 in the United States with a correlation coefficient (R) of 0.818 and weighted average of 9.2%. Similarly, the statistical analysis conducted on geographies consisting of 113,544,654 people shows a mild positive correlation between the proportion of Immigrants from Belize and unemployment rate among women with children between the ages 6 and 17 in the United States with a correlation coefficient (R) of 0.335 and weighted average of 9.3%, a difference of 0.79%.
Unemployment Among Women with Children Ages 6 to 17 years Correlation Summary
| Measurement | Immigrants from Eritrea | Immigrants from Belize |
| Minimum | 1.8% | 0.70% |
| Maximum | 61.5% | 25.2% |
| Range | 59.7% | 24.5% |
| Mean | 11.7% | 10.5% |
| Median | 8.2% | 9.3% |
| Interquartile 25% (IQ1) | 6.3% | 7.8% |
| Interquartile 75% (IQ3) | 12.6% | 13.5% |
| Interquartile Range (IQR) | 6.3% | 5.7% |
| Standard Deviation (Sample) | 10.5% | 5.1% |
| Standard Deviation (Population) | 10.3% | 5.0% |
Demographics Similar to Immigrants from Eritrea and Immigrants from Belize by Unemployment Among Women with Children Ages 6 to 17 years
In terms of unemployment among women with children ages 6 to 17 years, the demographic groups most similar to Immigrants from Eritrea are Crow (9.2%, a difference of 0.010%), Immigrants from Southern Europe (9.2%, a difference of 0.010%), Immigrants from El Salvador (9.3%, a difference of 0.10%), Chinese (9.3%, a difference of 0.11%), and Belgian (9.2%, a difference of 0.12%). Similarly, the demographic groups most similar to Immigrants from Belize are Hungarian (9.3%, a difference of 0.050%), Uruguayan (9.3%, a difference of 0.070%), Arab (9.3%, a difference of 0.080%), Immigrants from Saudi Arabia (9.3%, a difference of 0.080%), and Mexican (9.3%, a difference of 0.14%).
| Demographics | Rating | Rank | Unemployment Among Women with Children Ages 6 to 17 years |
| Belgians | 6.4 /100 | #220 | Tragic 9.2% |
| Crow | 5.8 /100 | #221 | Tragic 9.2% |
| Immigrants | Southern Europe | 5.8 /100 | #222 | Tragic 9.2% |
| Immigrants | Eritrea | 5.8 /100 | #223 | Tragic 9.2% |
| Immigrants | El Salvador | 5.3 /100 | #224 | Tragic 9.3% |
| Chinese | 5.2 /100 | #225 | Tragic 9.3% |
| Immigrants | Azores | 4.6 /100 | #226 | Tragic 9.3% |
| Panamanians | 4.5 /100 | #227 | Tragic 9.3% |
| Estonians | 4.4 /100 | #228 | Tragic 9.3% |
| Lumbee | 4.3 /100 | #229 | Tragic 9.3% |
| Welsh | 4.0 /100 | #230 | Tragic 9.3% |
| Macedonians | 3.9 /100 | #231 | Tragic 9.3% |
| French American Indians | 3.7 /100 | #232 | Tragic 9.3% |
| Immigrants | St. Vincent and the Grenadines | 3.3 /100 | #233 | Tragic 9.3% |
| Mexicans | 3.2 /100 | #234 | Tragic 9.3% |
| Uruguayans | 3.0 /100 | #235 | Tragic 9.3% |
| Hungarians | 3.0 /100 | #236 | Tragic 9.3% |
| Immigrants | Belize | 2.8 /100 | #237 | Tragic 9.3% |
| Arabs | 2.7 /100 | #238 | Tragic 9.3% |
| Immigrants | Saudi Arabia | 2.7 /100 | #239 | Tragic 9.3% |
| Guatemalans | 2.3 /100 | #240 | Tragic 9.3% |