Immigrants from Egypt vs Inupiat Unemployment Among Ages 20 to 24 years

COMPARE

Immigrants from Egypt
Race
Ancestry
AfghanAfricanAlaska NativeAlaskan AthabascanAlbanianAleutAlsatianAmericanApacheArabArapahoArgentineanArmenianAssyrian/Chaldean/SyriacAustralianAustrianBahamianBangladeshiBarbadianBasqueBelgianBelizeanBermudanBhutaneseBlackfeetBolivianBrazilianBritishBritish West IndianBulgarianBurmeseCajunCambodianCanadianCape VerdeanCarpatho RusynCelticCentral AmericanCentral American IndianCherokeeCheyenneChickasawChileanChineseChippewaChoctawColombianColvilleComancheCosta RicanCreeCreekCroatianCrowCubanCypriotCzechCzechoslovakianDanishDelawareDominicanDutchDutch West IndianEastern EuropeanEcuadorianEgyptianEnglishEstonianEthiopianEuropeanFijianFilipinoFinnishFrenchFrench American IndianFrench CanadianGermanGerman RussianGhanaianGreekGuamanian/ChamorroGuatemalanGuyaneseHaitianHmongHonduranHopiHoumaHungarianIcelanderIndian (Asian)IndonesianIranianIraqiIrishIroquoisIsraeliItalianJamaicanJapaneseJordanianKenyanKiowaKoreanLaotianLatvianLebaneseLiberianLithuanianLumbeeLuxembourgerMacedonianMalaysianMalteseMarshalleseMenomineeMexicanMexican American IndianMongolianMoroccanNative HawaiianNavajoNepaleseNew ZealanderNicaraguanNigerianNorthern EuropeanNorwegianOkinawanOsageOttawaPaiutePakistaniPalestinianPanamanianParaguayanPennsylvania GermanPeruvianPimaPolishPortuguesePotawatomiPuebloPuerto RicanPuget Sound SalishRomanianRussianSalvadoranSamoanScandinavianScotch-IrishScottishSeminoleSenegaleseSerbianShoshoneSierra LeoneanSiouxSlavicSlovakSloveneSomaliSouth AfricanSouth AmericanSouth American IndianSoviet UnionSpaniardSpanishSpanish AmericanSpanish American IndianSri LankanSubsaharan AfricanSudaneseSwedishSwissSyrianTaiwaneseThaiTlingit-HaidaTohono O'OdhamTonganTrinidadian and TobagonianTsimshianTurkishU.S. Virgin IslanderUgandanUkrainianUruguayanUteVenezuelanVietnameseWelshWest IndianYakamaYaquiYugoslavianYumanYup'ikZimbabwean
Immigration
NonimmigrantsImmigrantsAfghanistanAfricaAlbaniaArgentinaArmeniaAsiaAustraliaAustriaBahamasBangladeshBarbadosBelarusBelgiumBelizeBoliviaBosnia and HerzegovinaBrazilBulgariaBurma/MyanmarCabo VerdeCambodiaCameroonCanadaCaribbeanCentral AmericaChileChinaColombiaCongoCosta RicaCroatiaCubaCzechoslovakiaDenmarkDominicaDominican RepublicEastern AfricaEastern AsiaEastern EuropeEcuadorEgyptEl SalvadorEnglandEritreaEthiopiaEuropeFijiFranceGermanyGhanaGreeceGrenadaGuatemalaGuyanaHaitiHondurasHong KongHungaryIndiaIndonesiaIranIraqIrelandIsraelItalyJamaicaJapanJordanKazakhstanKenyaKoreaKuwaitLaosLatin AmericaLatviaLebanonLiberiaLithuaniaMalaysiaMexicoMicronesiaMiddle AfricaMoldovaMoroccoNepalNetherlandsNicaraguaNigeriaNorth AmericaNorth MacedoniaNorthern AfricaNorthern EuropeNorwayOceaniaPakistanPanamaPeruPhilippinesPolandPortugalRomaniaRussiaSaudi ArabiaScotlandSenegalSerbiaSierra LeoneSingaporeSomaliaSouth AfricaSouth AmericaSouth Central AsiaSouth Eastern AsiaSouthern EuropeSpainSri LankaSt. Vincent and the GrenadinesSudanSwedenSwitzerlandSyriaTaiwanThailandTrinidad and TobagoTurkeyUgandaUkraineUruguayUzbekistanVenezuelaVietnamWest IndiesWestern AfricaWestern AsiaWestern EuropeYemenZaireZimbabweAzores
Inupiat
Race
Ancestry
AfghanAfricanAlaska NativeAlaskan AthabascanAlbanianAleutAlsatianAmericanApacheArabArapahoArgentineanArmenianAssyrian/Chaldean/SyriacAustralianAustrianBahamianBangladeshiBarbadianBasqueBelgianBelizeanBermudanBhutaneseBlackfeetBolivianBrazilianBritishBritish West IndianBulgarianBurmeseCajunCambodianCanadianCape VerdeanCarpatho RusynCelticCentral AmericanCentral American IndianCherokeeCheyenneChickasawChileanChineseChippewaChoctawColombianColvilleComancheCosta RicanCreeCreekCroatianCrowCubanCypriotCzechCzechoslovakianDanishDelawareDominicanDutchDutch West IndianEastern EuropeanEcuadorianEgyptianEnglishEstonianEthiopianEuropeanFijianFilipinoFinnishFrenchFrench American IndianFrench CanadianGermanGerman RussianGhanaianGreekGuamanian/ChamorroGuatemalanGuyaneseHaitianHmongHonduranHopiHoumaHungarianIcelanderIndian (Asian)IndonesianInupiatIranianIraqiIrishIroquoisIsraeliItalianJamaicanJapaneseJordanianKenyanKiowaKoreanLaotianLatvianLebaneseLiberianLithuanianLumbeeLuxembourgerMacedonianMalaysianMalteseMarshalleseMenomineeMexicanMexican American IndianMongolianMoroccanNative HawaiianNavajoNepaleseNew ZealanderNicaraguanNigerianNorthern EuropeanNorwegianOkinawanOsageOttawaPaiutePakistaniPalestinianPanamanianParaguayanPennsylvania GermanPeruvianPimaPolishPortuguesePotawatomiPuebloPuerto RicanPuget Sound SalishRomanianRussianSalvadoranSamoanScandinavianScotch-IrishScottishSeminoleSenegaleseSerbianShoshoneSierra LeoneanSiouxSlavicSlovakSloveneSomaliSouth AfricanSouth AmericanSouth American IndianSoviet UnionSpaniardSpanishSpanish AmericanSpanish American IndianSri LankanSubsaharan AfricanSudaneseSwedishSwissSyrianTaiwaneseThaiTlingit-HaidaTohono O'OdhamTonganTrinidadian and TobagonianTsimshianTurkishU.S. Virgin IslanderUgandanUkrainianUruguayanUteVenezuelanVietnameseWelshWest IndianYakamaYaquiYugoslavianYumanYup'ikZimbabwean
Immigration
NonimmigrantsImmigrantsAfghanistanAfricaAlbaniaArgentinaArmeniaAsiaAustraliaAustriaBahamasBangladeshBarbadosBelarusBelgiumBelizeBoliviaBosnia and HerzegovinaBrazilBulgariaBurma/MyanmarCabo VerdeCambodiaCameroonCanadaCaribbeanCentral AmericaChileChinaColombiaCongoCosta RicaCroatiaCubaCzechoslovakiaDenmarkDominicaDominican RepublicEastern AfricaEastern AsiaEastern EuropeEcuadorEl SalvadorEnglandEritreaEthiopiaEuropeFijiFranceGermanyGhanaGreeceGrenadaGuatemalaGuyanaHaitiHondurasHong KongHungaryIndiaIndonesiaIranIraqIrelandIsraelItalyJamaicaJapanJordanKazakhstanKenyaKoreaKuwaitLaosLatin AmericaLatviaLebanonLiberiaLithuaniaMalaysiaMexicoMicronesiaMiddle AfricaMoldovaMoroccoNepalNetherlandsNicaraguaNigeriaNorth AmericaNorth MacedoniaNorthern AfricaNorthern EuropeNorwayOceaniaPakistanPanamaPeruPhilippinesPolandPortugalRomaniaRussiaSaudi ArabiaScotlandSenegalSerbiaSierra LeoneSingaporeSomaliaSouth AfricaSouth AmericaSouth Central AsiaSouth Eastern AsiaSouthern EuropeSpainSri LankaSt. Vincent and the GrenadinesSudanSwedenSwitzerlandSyriaTaiwanThailandTrinidad and TobagoTurkeyUgandaUkraineUruguayUzbekistanVenezuelaVietnamWest IndiesWestern AfricaWestern AsiaWestern EuropeYemenZaireZimbabweAzores
Unemployment Among Ages 20 to 24 years
Income
Poverty
Unemployment
Labor Participation
Family Structure
Vehicle Availability
Education Level
Disability

Unemployment Among Ages 20 to 24 years Comparison

Immigrants from Egypt

Inupiat

Fair
Tragic
10.4%
UNEMPLOYMENT AMONG AGES 20 TO 24 YEARS
37.4/ 100
METRIC RATING
183rd/ 347
METRIC RANK
20.9%
UNEMPLOYMENT AMONG AGES 20 TO 24 YEARS
0.0/ 100
METRIC RATING
347th/ 347
METRIC RANK

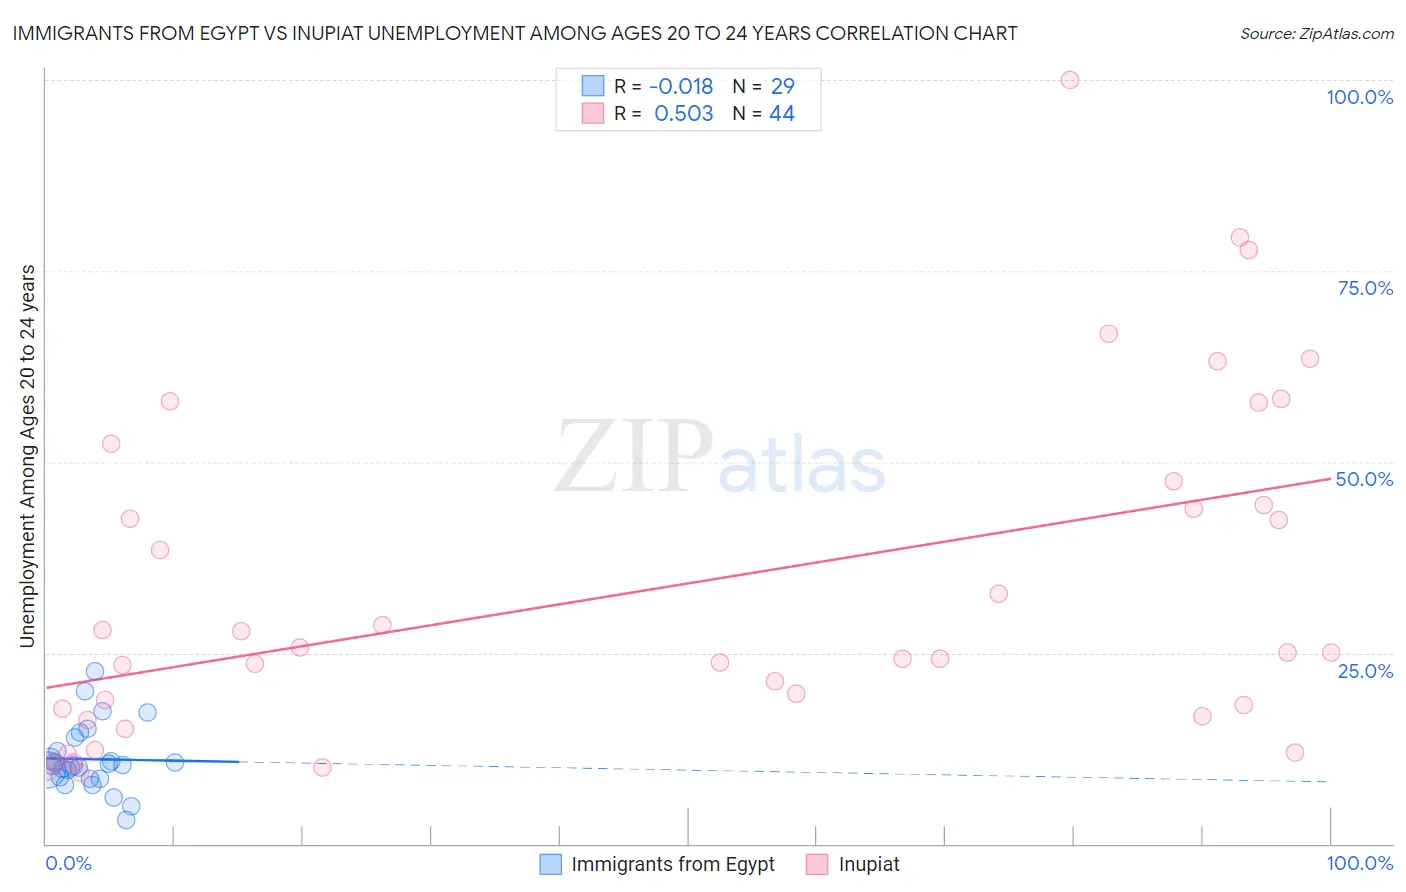
Immigrants from Egypt vs Inupiat Unemployment Among Ages 20 to 24 years Correlation Chart

The statistical analysis conducted on geographies consisting of 242,364,563 people shows no correlation between the proportion of Immigrants from Egypt and unemployment rate among population between the ages 20 and 24 in the United States with a correlation coefficient (R) of -0.018 and weighted average of 10.4%. Similarly, the statistical analysis conducted on geographies consisting of 95,459,748 people shows a substantial positive correlation between the proportion of Inupiat and unemployment rate among population between the ages 20 and 24 in the United States with a correlation coefficient (R) of 0.503 and weighted average of 20.9%, a difference of 102.0%.
Immigrants from Egypt vs Inupiat Unemployment Among Ages 20 to 24 years

Unemployment Among Ages 20 to 24 years Correlation Summary

MeasurementImmigrants from EgyptInupiat
Minimum3.1%9.4%
Maximum22.6%100.0%
Range19.5%90.6%
Mean11.1%33.6%
Median10.2%25.0%
Interquartile 25% (IQ1)8.6%17.2%
Interquartile 75% (IQ3)13.0%45.9%
Interquartile Range (IQR)4.4%28.7%
Standard Deviation (Sample)4.2%22.1%
Standard Deviation (Population)4.2%21.8%

Similar Demographics by Unemployment Among Ages 20 to 24 years

Demographics Similar to Immigrants from Egypt by Unemployment Among Ages 20 to 24 years

In terms of unemployment among ages 20 to 24 years, the demographic groups most similar to Immigrants from Egypt are Greek (10.4%, a difference of 0.010%), Immigrants from Germany (10.4%, a difference of 0.030%), Okinawan (10.3%, a difference of 0.060%), Syrian (10.4%, a difference of 0.070%), and Immigrants from Turkey (10.3%, a difference of 0.080%).
DemographicsRating | RankUnemployment Among Ages 20 to 24 years
Potawatomi
42.0
/100
|
#176
Average
10.3%
Immigrants | Czechoslovakia
40.8
/100
|
#177
Average
10.3%
Alsatians
40.5
/100
|
#178
Average
10.3%
Tlingit-Haida
39.7
/100
|
#179
Fair
10.3%
Immigrants | Turkey
39.3
/100
|
#180
Fair
10.3%
Okinawans
39.1
/100
|
#181
Fair
10.3%
Immigrants | Germany
38.1
/100
|
#182
Fair
10.4%
Immigrants | Egypt
37.4
/100
|
#183
Fair
10.4%
Greeks
37.2
/100
|
#184
Fair
10.4%
Syrians
35.6
/100
|
#185
Fair
10.4%
Guamanians/Chamorros
35.4
/100
|
#186
Fair
10.4%
Immigrants | Western Europe
35.0
/100
|
#187
Fair
10.4%
Immigrants | Russia
34.6
/100
|
#188
Fair
10.4%
Hawaiians
33.9
/100
|
#189
Fair
10.4%
Immigrants | China
32.6
/100
|
#190
Fair
10.4%

Demographics Similar to Inupiat by Unemployment Among Ages 20 to 24 years

In terms of unemployment among ages 20 to 24 years, the demographic groups most similar to Inupiat are Yup'ik (20.9%, a difference of 0.27%), Hopi (19.9%, a difference of 5.2%), Crow (18.7%, a difference of 11.7%), Tsimshian (18.0%, a difference of 16.4%), and Puerto Rican (16.7%, a difference of 25.6%).
DemographicsRating | RankUnemployment Among Ages 20 to 24 years
Immigrants | Guyana
0.0
/100
|
#333
Tragic
13.9%
Guyanese
0.0
/100
|
#334
Tragic
14.0%
Sioux
0.0
/100
|
#335
Tragic
14.2%
Pima
0.0
/100
|
#336
Tragic
14.2%
Paiute
0.0
/100
|
#337
Tragic
14.3%
Immigrants | St. Vincent and the Grenadines
0.0
/100
|
#338
Tragic
14.3%
Immigrants | Yemen
0.0
/100
|
#339
Tragic
14.9%
Yuman
0.0
/100
|
#340
Tragic
15.8%
Navajo
0.0
/100
|
#341
Tragic
16.1%
Puerto Ricans
0.0
/100
|
#342
Tragic
16.7%
Tsimshian
0.0
/100
|
#343
Tragic
18.0%
Crow
0.0
/100
|
#344
Tragic
18.7%
Hopi
0.0
/100
|
#345
Tragic
19.9%
Yup'ik
0.0
/100
|
#346
Tragic
20.9%
Inupiat
0.0
/100
|
#347
Tragic
20.9%