Immigrants from Bosnia and Herzegovina vs Inupiat Unemployment Among Ages 20 to 24 years
COMPARE
Immigrants from Bosnia and Herzegovina
Inupiat
Unemployment Among Ages 20 to 24 years
Unemployment Among Ages 20 to 24 years Comparison
Immigrants from Bosnia and Herzegovina
Inupiat
9.4%
UNEMPLOYMENT AMONG AGES 20 TO 24 YEARS
100.0/ 100
METRIC RATING
21st/ 347
METRIC RANK
20.9%
UNEMPLOYMENT AMONG AGES 20 TO 24 YEARS
0.0/ 100
METRIC RATING
347th/ 347
METRIC RANK
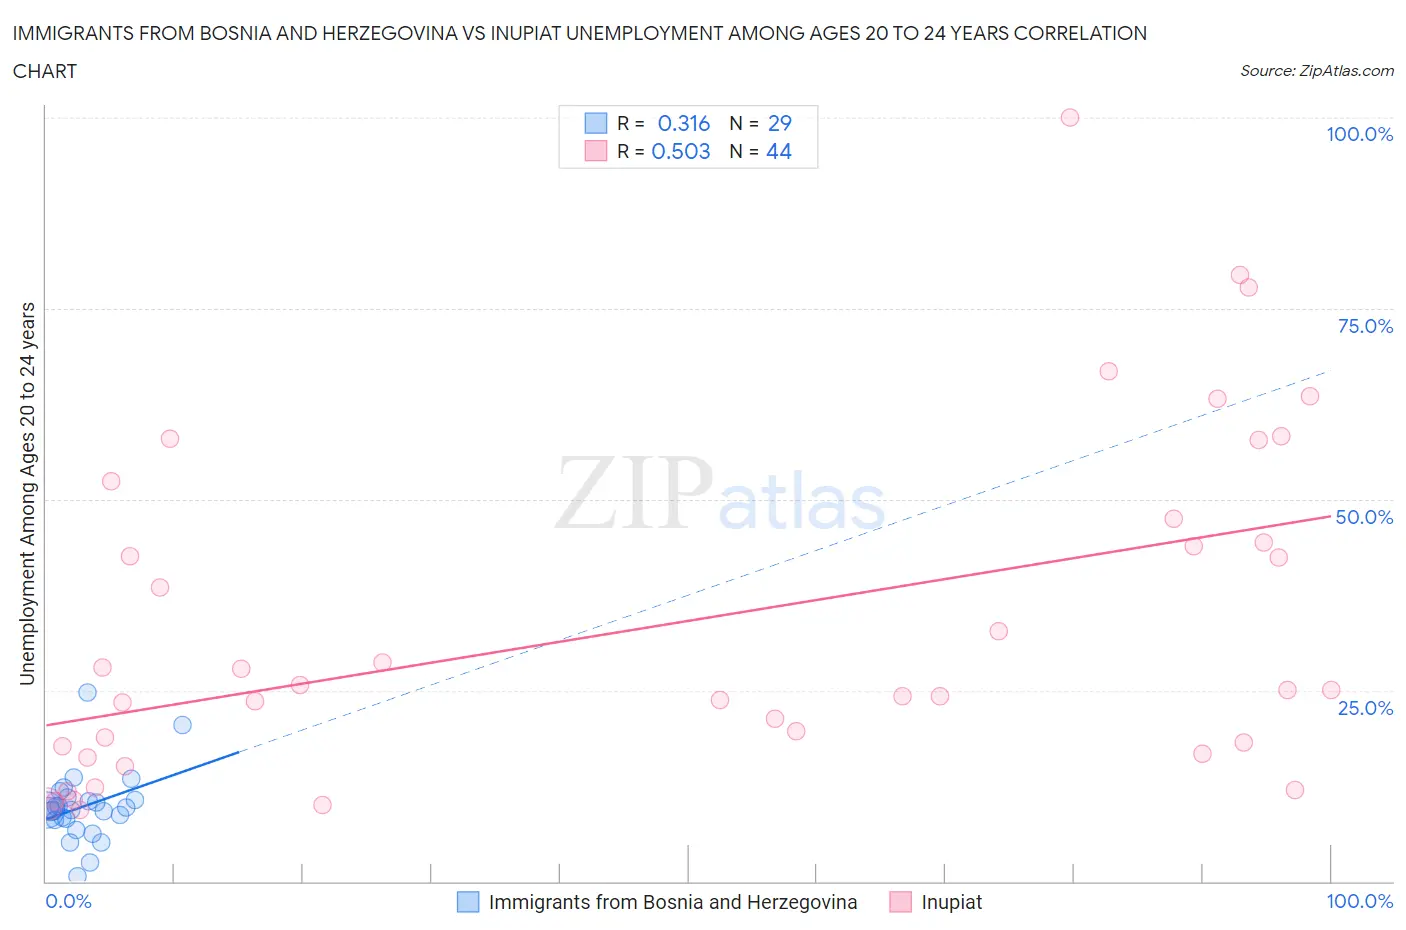
Immigrants from Bosnia and Herzegovina vs Inupiat Unemployment Among Ages 20 to 24 years Correlation Chart
The statistical analysis conducted on geographies consisting of 154,747,093 people shows a mild positive correlation between the proportion of Immigrants from Bosnia and Herzegovina and unemployment rate among population between the ages 20 and 24 in the United States with a correlation coefficient (R) of 0.316 and weighted average of 9.4%. Similarly, the statistical analysis conducted on geographies consisting of 95,459,748 people shows a substantial positive correlation between the proportion of Inupiat and unemployment rate among population between the ages 20 and 24 in the United States with a correlation coefficient (R) of 0.503 and weighted average of 20.9%, a difference of 123.0%.
Unemployment Among Ages 20 to 24 years Correlation Summary
| Measurement | Immigrants from Bosnia and Herzegovina | Inupiat |
| Minimum | 0.70% | 9.4% |
| Maximum | 24.7% | 100.0% |
| Range | 24.0% | 90.6% |
| Mean | 9.8% | 33.6% |
| Median | 9.4% | 25.0% |
| Interquartile 25% (IQ1) | 8.1% | 17.2% |
| Interquartile 75% (IQ3) | 10.8% | 45.9% |
| Interquartile Range (IQR) | 2.6% | 28.7% |
| Standard Deviation (Sample) | 4.6% | 22.1% |
| Standard Deviation (Population) | 4.5% | 21.8% |
Similar Demographics by Unemployment Among Ages 20 to 24 years
Demographics Similar to Immigrants from Bosnia and Herzegovina by Unemployment Among Ages 20 to 24 years
In terms of unemployment among ages 20 to 24 years, the demographic groups most similar to Immigrants from Bosnia and Herzegovina are Hmong (9.4%, a difference of 0.010%), Osage (9.4%, a difference of 0.010%), Chinese (9.4%, a difference of 0.13%), Tongan (9.4%, a difference of 0.27%), and Immigrants from Nepal (9.4%, a difference of 0.27%).
| Demographics | Rating | Rank | Unemployment Among Ages 20 to 24 years |
| Slovenes | 100.0 /100 | #14 | Exceptional 9.3% |
| Immigrants | Sudan | 100.0 /100 | #15 | Exceptional 9.3% |
| Danes | 100.0 /100 | #16 | Exceptional 9.3% |
| Czechs | 100.0 /100 | #17 | Exceptional 9.3% |
| Chinese | 100.0 /100 | #18 | Exceptional 9.4% |
| Hmong | 100.0 /100 | #19 | Exceptional 9.4% |
| Osage | 100.0 /100 | #20 | Exceptional 9.4% |
| Immigrants | Bosnia and Herzegovina | 100.0 /100 | #21 | Exceptional 9.4% |
| Tongans | 100.0 /100 | #22 | Exceptional 9.4% |
| Immigrants | Nepal | 100.0 /100 | #23 | Exceptional 9.4% |
| Taiwanese | 100.0 /100 | #24 | Exceptional 9.4% |
| Immigrants | Eritrea | 100.0 /100 | #25 | Exceptional 9.5% |
| Swedes | 100.0 /100 | #26 | Exceptional 9.5% |
| Immigrants | Zimbabwe | 100.0 /100 | #27 | Exceptional 9.5% |
| Immigrants | Afghanistan | 100.0 /100 | #28 | Exceptional 9.5% |
Demographics Similar to Inupiat by Unemployment Among Ages 20 to 24 years
In terms of unemployment among ages 20 to 24 years, the demographic groups most similar to Inupiat are Yup'ik (20.9%, a difference of 0.27%), Hopi (19.9%, a difference of 5.2%), Crow (18.7%, a difference of 11.7%), Tsimshian (18.0%, a difference of 16.4%), and Puerto Rican (16.7%, a difference of 25.6%).
| Demographics | Rating | Rank | Unemployment Among Ages 20 to 24 years |
| Immigrants | Guyana | 0.0 /100 | #333 | Tragic 13.9% |
| Guyanese | 0.0 /100 | #334 | Tragic 14.0% |
| Sioux | 0.0 /100 | #335 | Tragic 14.2% |
| Pima | 0.0 /100 | #336 | Tragic 14.2% |
| Paiute | 0.0 /100 | #337 | Tragic 14.3% |
| Immigrants | St. Vincent and the Grenadines | 0.0 /100 | #338 | Tragic 14.3% |
| Immigrants | Yemen | 0.0 /100 | #339 | Tragic 14.9% |
| Yuman | 0.0 /100 | #340 | Tragic 15.8% |
| Navajo | 0.0 /100 | #341 | Tragic 16.1% |
| Puerto Ricans | 0.0 /100 | #342 | Tragic 16.7% |
| Tsimshian | 0.0 /100 | #343 | Tragic 18.0% |
| Crow | 0.0 /100 | #344 | Tragic 18.7% |
| Hopi | 0.0 /100 | #345 | Tragic 19.9% |
| Yup'ik | 0.0 /100 | #346 | Tragic 20.9% |
| Inupiat | 0.0 /100 | #347 | Tragic 20.9% |