Immigrants from Egypt vs Costa Rican Unemployment Among Seniors over 75 years
COMPARE
Immigrants from Egypt
Costa Rican
Unemployment Among Seniors over 75 years
Unemployment Among Seniors over 75 years Comparison
Immigrants from Egypt
Costa Ricans
7.9%
UNEMPLOYMENT AMONG SENIORS OVER 75 YEARS
100.0/ 100
METRIC RATING
53rd/ 347
METRIC RANK
9.1%
UNEMPLOYMENT AMONG SENIORS OVER 75 YEARS
6.3/ 100
METRIC RATING
224th/ 347
METRIC RANK
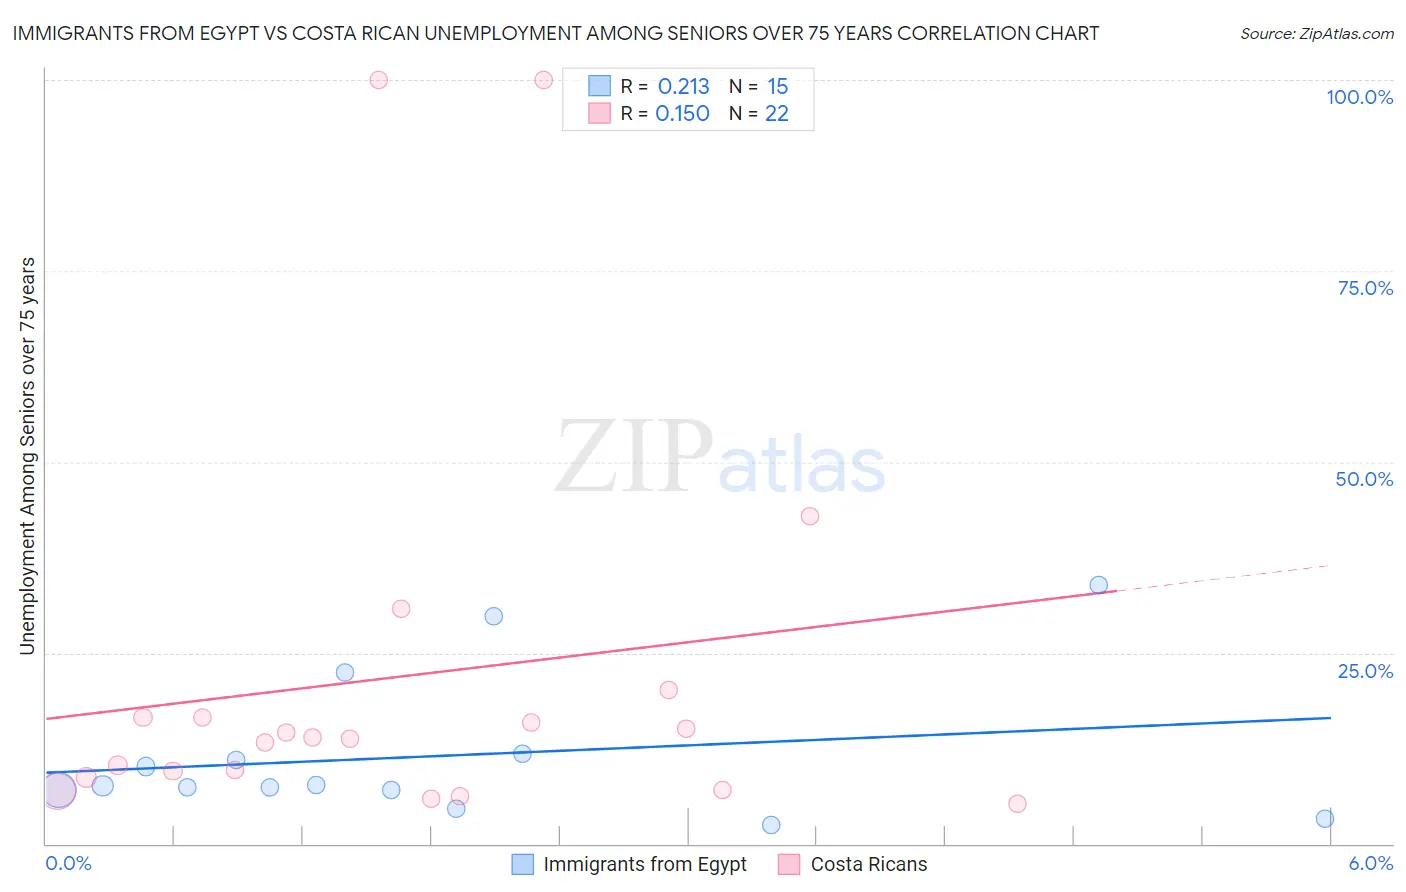
Immigrants from Egypt vs Costa Rican Unemployment Among Seniors over 75 years Correlation Chart
The statistical analysis conducted on geographies consisting of 152,094,577 people shows a weak positive correlation between the proportion of Immigrants from Egypt and unemployment rate among seniors over the age of 75 in the United States with a correlation coefficient (R) of 0.213 and weighted average of 7.9%. Similarly, the statistical analysis conducted on geographies consisting of 153,154,168 people shows a poor positive correlation between the proportion of Costa Ricans and unemployment rate among seniors over the age of 75 in the United States with a correlation coefficient (R) of 0.150 and weighted average of 9.1%, a difference of 15.4%.
Unemployment Among Seniors over 75 years Correlation Summary
| Measurement | Immigrants from Egypt | Costa Rican |
| Minimum | 2.5% | 5.3% |
| Maximum | 33.9% | 100.0% |
| Range | 31.4% | 94.7% |
| Mean | 11.5% | 21.9% |
| Median | 7.6% | 13.8% |
| Interquartile 25% (IQ1) | 7.1% | 8.7% |
| Interquartile 75% (IQ3) | 11.8% | 16.6% |
| Interquartile Range (IQR) | 4.7% | 7.9% |
| Standard Deviation (Sample) | 9.5% | 26.7% |
| Standard Deviation (Population) | 9.2% | 26.1% |
Similar Demographics by Unemployment Among Seniors over 75 years
Demographics Similar to Immigrants from Egypt by Unemployment Among Seniors over 75 years
In terms of unemployment among seniors over 75 years, the demographic groups most similar to Immigrants from Egypt are Immigrants from Malaysia (7.9%, a difference of 0.040%), Bahamian (7.8%, a difference of 0.070%), Moroccan (7.8%, a difference of 0.31%), Immigrants from Latvia (7.8%, a difference of 0.36%), and Filipino (7.9%, a difference of 0.36%).
| Demographics | Rating | Rank | Unemployment Among Seniors over 75 years |
| Immigrants | China | 100.0 /100 | #46 | Exceptional 7.8% |
| Creek | 100.0 /100 | #47 | Exceptional 7.8% |
| Immigrants | Chile | 100.0 /100 | #48 | Exceptional 7.8% |
| Potawatomi | 100.0 /100 | #49 | Exceptional 7.8% |
| Immigrants | Latvia | 100.0 /100 | #50 | Exceptional 7.8% |
| Moroccans | 100.0 /100 | #51 | Exceptional 7.8% |
| Bahamians | 100.0 /100 | #52 | Exceptional 7.8% |
| Immigrants | Egypt | 100.0 /100 | #53 | Exceptional 7.9% |
| Immigrants | Malaysia | 99.9 /100 | #54 | Exceptional 7.9% |
| Filipinos | 99.9 /100 | #55 | Exceptional 7.9% |
| Immigrants | Eastern Asia | 99.9 /100 | #56 | Exceptional 7.9% |
| Ottawa | 99.9 /100 | #57 | Exceptional 7.9% |
| Iranians | 99.9 /100 | #58 | Exceptional 7.9% |
| Indonesians | 99.9 /100 | #59 | Exceptional 7.9% |
| Immigrants | Morocco | 99.9 /100 | #60 | Exceptional 7.9% |
Demographics Similar to Costa Ricans by Unemployment Among Seniors over 75 years
In terms of unemployment among seniors over 75 years, the demographic groups most similar to Costa Ricans are Navajo (9.1%, a difference of 0.040%), Immigrants from Bangladesh (9.1%, a difference of 0.090%), Immigrants from Jordan (9.0%, a difference of 0.14%), Samoan (9.1%, a difference of 0.14%), and Peruvian (9.0%, a difference of 0.20%).
| Demographics | Rating | Rank | Unemployment Among Seniors over 75 years |
| Lebanese | 11.1 /100 | #217 | Poor 9.0% |
| Immigrants | Africa | 9.7 /100 | #218 | Tragic 9.0% |
| Afghans | 8.3 /100 | #219 | Tragic 9.0% |
| Immigrants | Zimbabwe | 7.8 /100 | #220 | Tragic 9.0% |
| Guamanians/Chamorros | 7.7 /100 | #221 | Tragic 9.0% |
| Peruvians | 7.3 /100 | #222 | Tragic 9.0% |
| Immigrants | Jordan | 6.9 /100 | #223 | Tragic 9.0% |
| Costa Ricans | 6.3 /100 | #224 | Tragic 9.1% |
| Navajo | 6.1 /100 | #225 | Tragic 9.1% |
| Immigrants | Bangladesh | 5.9 /100 | #226 | Tragic 9.1% |
| Samoans | 5.7 /100 | #227 | Tragic 9.1% |
| Kenyans | 5.4 /100 | #228 | Tragic 9.1% |
| Hispanics or Latinos | 5.0 /100 | #229 | Tragic 9.1% |
| Northern Europeans | 4.9 /100 | #230 | Tragic 9.1% |
| Immigrants | Central America | 4.9 /100 | #231 | Tragic 9.1% |