Immigrants from Denmark vs Yaqui Unemployment Among Seniors over 75 years
COMPARE
Immigrants from Denmark
Yaqui
Unemployment Among Seniors over 75 years
Unemployment Among Seniors over 75 years Comparison
Immigrants from Denmark
Yaqui
7.8%
UNEMPLOYMENT AMONG SENIORS OVER 75 YEARS
100.0/ 100
METRIC RATING
43rd/ 347
METRIC RANK
9.4%
UNEMPLOYMENT AMONG SENIORS OVER 75 YEARS
0.3/ 100
METRIC RATING
270th/ 347
METRIC RANK
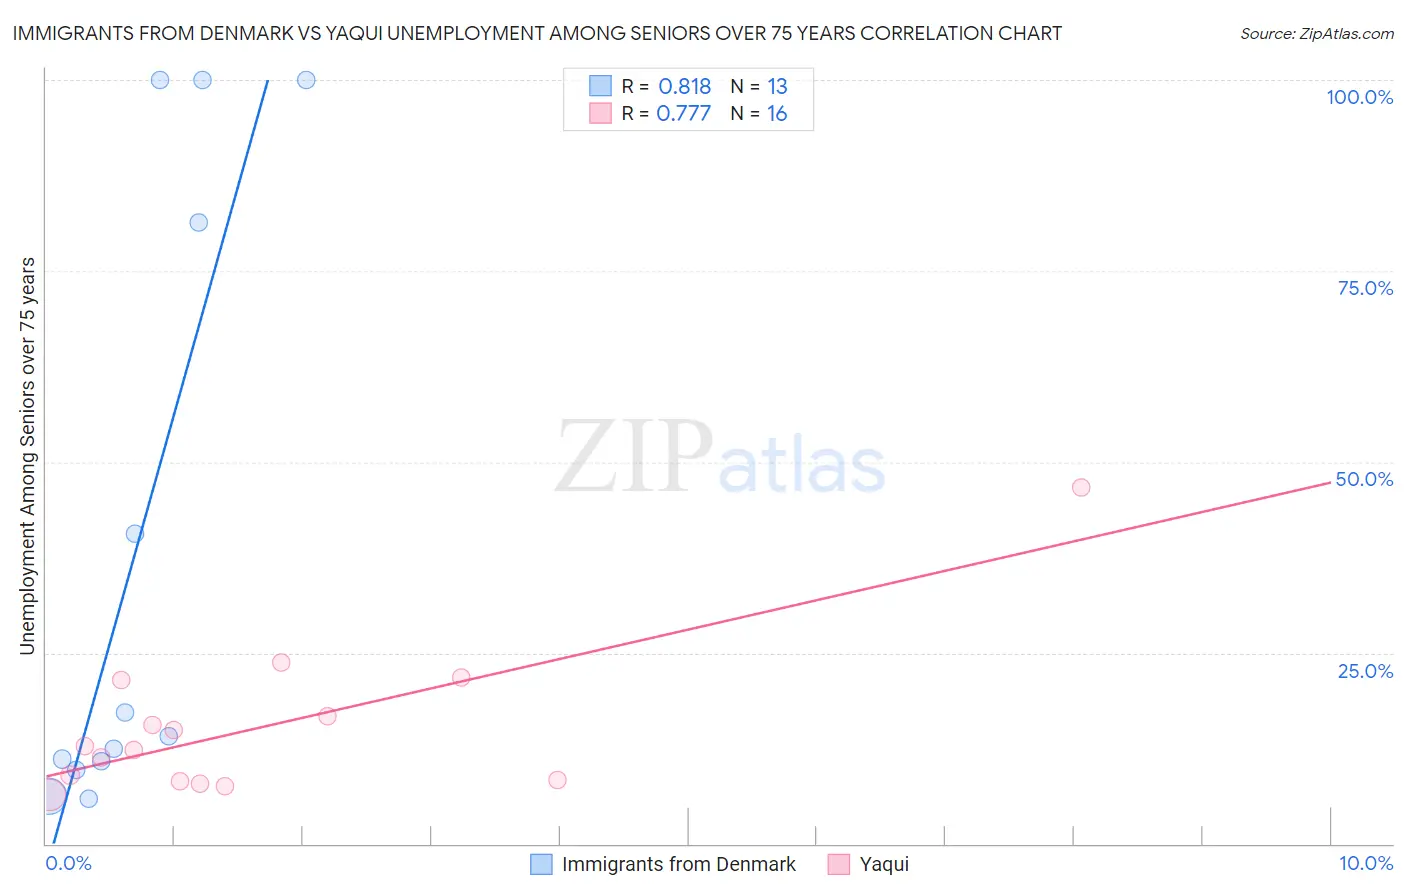
Immigrants from Denmark vs Yaqui Unemployment Among Seniors over 75 years Correlation Chart
The statistical analysis conducted on geographies consisting of 98,267,955 people shows a very strong positive correlation between the proportion of Immigrants from Denmark and unemployment rate among seniors over the age of 75 in the United States with a correlation coefficient (R) of 0.818 and weighted average of 7.8%. Similarly, the statistical analysis conducted on geographies consisting of 78,300,262 people shows a strong positive correlation between the proportion of Yaqui and unemployment rate among seniors over the age of 75 in the United States with a correlation coefficient (R) of 0.777 and weighted average of 9.4%, a difference of 21.4%.
Unemployment Among Seniors over 75 years Correlation Summary
| Measurement | Immigrants from Denmark | Yaqui |
| Minimum | 5.8% | 6.4% |
| Maximum | 100.0% | 46.7% |
| Range | 94.2% | 40.3% |
| Mean | 39.1% | 15.3% |
| Median | 14.0% | 12.5% |
| Interquartile 25% (IQ1) | 10.2% | 8.3% |
| Interquartile 75% (IQ3) | 90.7% | 19.1% |
| Interquartile Range (IQR) | 80.4% | 10.8% |
| Standard Deviation (Sample) | 40.2% | 10.0% |
| Standard Deviation (Population) | 38.6% | 9.7% |
Similar Demographics by Unemployment Among Seniors over 75 years
Demographics Similar to Immigrants from Denmark by Unemployment Among Seniors over 75 years
In terms of unemployment among seniors over 75 years, the demographic groups most similar to Immigrants from Denmark are Immigrants from Spain (7.8%, a difference of 0.040%), British West Indian (7.8%, a difference of 0.050%), Immigrants from China (7.8%, a difference of 0.11%), Pueblo (7.7%, a difference of 0.30%), and Creek (7.8%, a difference of 0.52%).
| Demographics | Rating | Rank | Unemployment Among Seniors over 75 years |
| Luxembourgers | 100.0 /100 | #36 | Exceptional 7.7% |
| Immigrants | Hungary | 100.0 /100 | #37 | Exceptional 7.7% |
| Kiowa | 100.0 /100 | #38 | Exceptional 7.7% |
| Ugandans | 100.0 /100 | #39 | Exceptional 7.7% |
| Colville | 100.0 /100 | #40 | Exceptional 7.7% |
| Immigrants | Burma/Myanmar | 100.0 /100 | #41 | Exceptional 7.7% |
| Pueblo | 100.0 /100 | #42 | Exceptional 7.7% |
| Immigrants | Denmark | 100.0 /100 | #43 | Exceptional 7.8% |
| Immigrants | Spain | 100.0 /100 | #44 | Exceptional 7.8% |
| British West Indians | 100.0 /100 | #45 | Exceptional 7.8% |
| Immigrants | China | 100.0 /100 | #46 | Exceptional 7.8% |
| Creek | 100.0 /100 | #47 | Exceptional 7.8% |
| Immigrants | Chile | 100.0 /100 | #48 | Exceptional 7.8% |
| Potawatomi | 100.0 /100 | #49 | Exceptional 7.8% |
| Immigrants | Latvia | 100.0 /100 | #50 | Exceptional 7.8% |
Demographics Similar to Yaqui by Unemployment Among Seniors over 75 years
In terms of unemployment among seniors over 75 years, the demographic groups most similar to Yaqui are Bulgarian (9.4%, a difference of 0.080%), Puerto Rican (9.4%, a difference of 0.090%), Immigrants from Iraq (9.4%, a difference of 0.11%), Greek (9.4%, a difference of 0.23%), and Czechoslovakian (9.4%, a difference of 0.25%).
| Demographics | Rating | Rank | Unemployment Among Seniors over 75 years |
| Ukrainians | 0.7 /100 | #263 | Tragic 9.3% |
| Iroquois | 0.7 /100 | #264 | Tragic 9.3% |
| Palestinians | 0.6 /100 | #265 | Tragic 9.3% |
| Blacks/African Americans | 0.5 /100 | #266 | Tragic 9.4% |
| Immigrants | Mexico | 0.4 /100 | #267 | Tragic 9.4% |
| Greeks | 0.4 /100 | #268 | Tragic 9.4% |
| Puerto Ricans | 0.3 /100 | #269 | Tragic 9.4% |
| Yaqui | 0.3 /100 | #270 | Tragic 9.4% |
| Bulgarians | 0.3 /100 | #271 | Tragic 9.4% |
| Immigrants | Iraq | 0.3 /100 | #272 | Tragic 9.4% |
| Czechoslovakians | 0.3 /100 | #273 | Tragic 9.4% |
| Jamaicans | 0.2 /100 | #274 | Tragic 9.5% |
| Senegalese | 0.2 /100 | #275 | Tragic 9.5% |
| Arabs | 0.2 /100 | #276 | Tragic 9.5% |
| Swiss | 0.1 /100 | #277 | Tragic 9.5% |