Immigrants from Croatia vs South American Unemployment Among Women with Children Ages 6 to 17 years
COMPARE
Immigrants from Croatia
South American
Unemployment Among Women with Children Ages 6 to 17 years
Unemployment Among Women with Children Ages 6 to 17 years Comparison
Immigrants from Croatia
South Americans
8.9%
UNEMPLOYMENT AMONG WOMEN WITH CHILDREN AGES 6 TO 17 YEARS
57.1/ 100
METRIC RATING
168th/ 347
METRIC RANK
9.5%
UNEMPLOYMENT AMONG WOMEN WITH CHILDREN AGES 6 TO 17 YEARS
0.5/ 100
METRIC RATING
261st/ 347
METRIC RANK
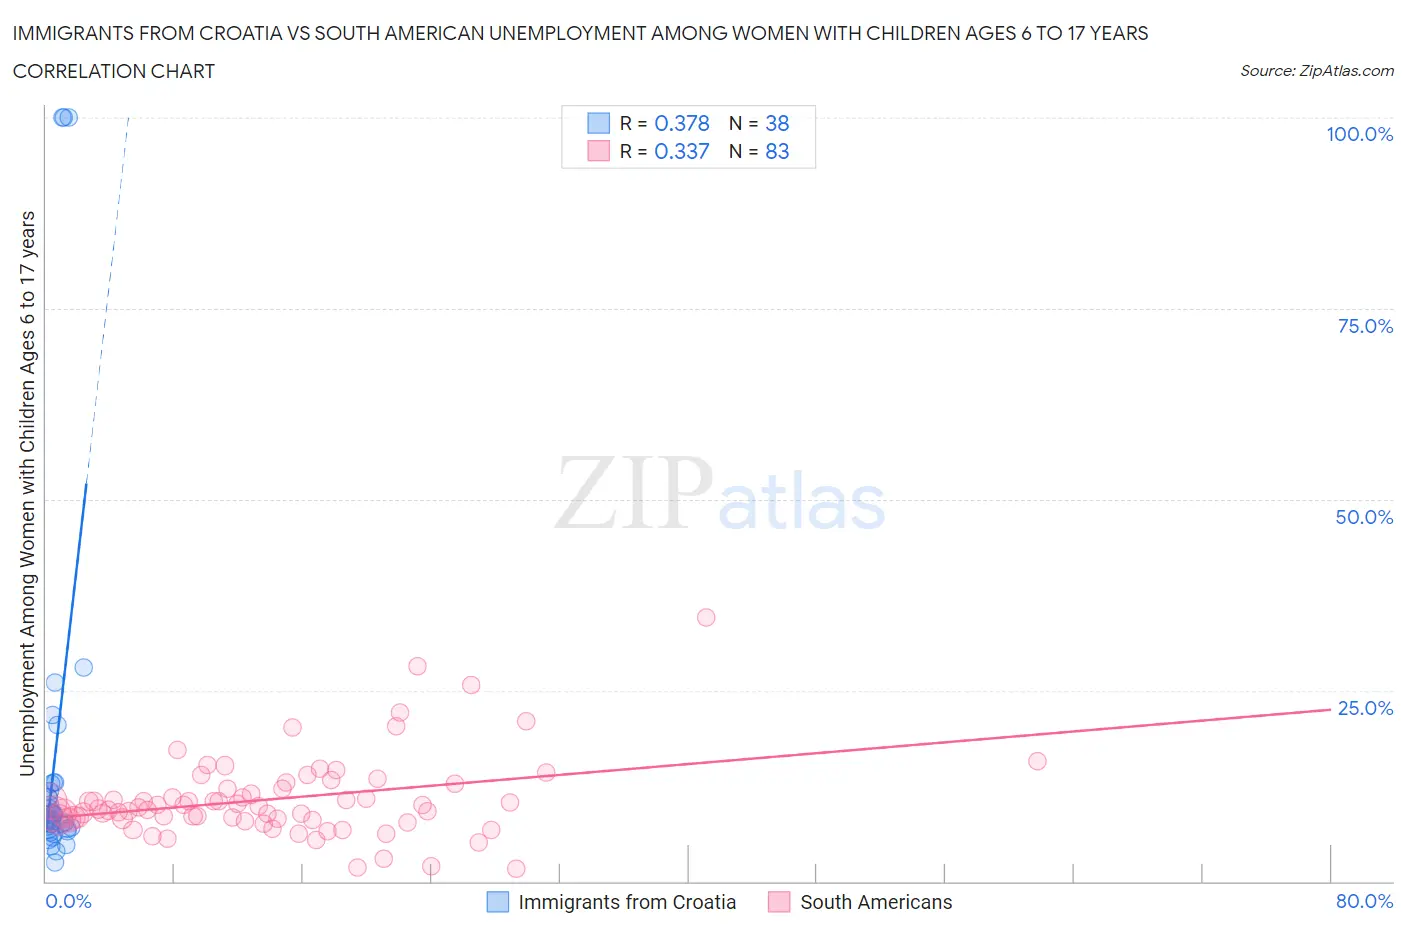
Immigrants from Croatia vs South American Unemployment Among Women with Children Ages 6 to 17 years Correlation Chart
The statistical analysis conducted on geographies consisting of 108,607,128 people shows a mild positive correlation between the proportion of Immigrants from Croatia and unemployment rate among women with children between the ages 6 and 17 in the United States with a correlation coefficient (R) of 0.378 and weighted average of 8.9%. Similarly, the statistical analysis conducted on geographies consisting of 336,338,597 people shows a mild positive correlation between the proportion of South Americans and unemployment rate among women with children between the ages 6 and 17 in the United States with a correlation coefficient (R) of 0.337 and weighted average of 9.5%, a difference of 6.1%.
Unemployment Among Women with Children Ages 6 to 17 years Correlation Summary
| Measurement | Immigrants from Croatia | South American |
| Minimum | 2.4% | 1.6% |
| Maximum | 100.0% | 34.5% |
| Range | 97.6% | 32.9% |
| Mean | 17.0% | 10.7% |
| Median | 8.5% | 9.7% |
| Interquartile 25% (IQ1) | 6.9% | 8.1% |
| Interquartile 75% (IQ3) | 12.8% | 12.2% |
| Interquartile Range (IQR) | 5.8% | 4.1% |
| Standard Deviation (Sample) | 25.3% | 5.4% |
| Standard Deviation (Population) | 24.9% | 5.3% |
Similar Demographics by Unemployment Among Women with Children Ages 6 to 17 years
Demographics Similar to Immigrants from Croatia by Unemployment Among Women with Children Ages 6 to 17 years
In terms of unemployment among women with children ages 6 to 17 years, the demographic groups most similar to Immigrants from Croatia are Immigrants from England (8.9%, a difference of 0.030%), Moroccan (8.9%, a difference of 0.060%), British (8.9%, a difference of 0.080%), Immigrants from Micronesia (8.9%, a difference of 0.10%), and Ukrainian (8.9%, a difference of 0.12%).
| Demographics | Rating | Rank | Unemployment Among Women with Children Ages 6 to 17 years |
| Immigrants | Guyana | 63.0 /100 | #161 | Good 8.9% |
| Immigrants | Netherlands | 60.8 /100 | #162 | Good 8.9% |
| Mexican American Indians | 60.6 /100 | #163 | Good 8.9% |
| Ukrainians | 59.7 /100 | #164 | Average 8.9% |
| Immigrants | Micronesia | 59.2 /100 | #165 | Average 8.9% |
| Moroccans | 58.3 /100 | #166 | Average 8.9% |
| Immigrants | England | 57.7 /100 | #167 | Average 8.9% |
| Immigrants | Croatia | 57.1 /100 | #168 | Average 8.9% |
| British | 55.2 /100 | #169 | Average 8.9% |
| Turks | 54.1 /100 | #170 | Average 8.9% |
| Jordanians | 52.2 /100 | #171 | Average 9.0% |
| Immigrants | West Indies | 52.2 /100 | #172 | Average 9.0% |
| Immigrants | Brazil | 51.0 /100 | #173 | Average 9.0% |
| Immigrants | Costa Rica | 50.0 /100 | #174 | Average 9.0% |
| Immigrants | Sierra Leone | 45.9 /100 | #175 | Average 9.0% |
Demographics Similar to South Americans by Unemployment Among Women with Children Ages 6 to 17 years
In terms of unemployment among women with children ages 6 to 17 years, the demographic groups most similar to South Americans are Senegalese (9.5%, a difference of 0.050%), Italian (9.5%, a difference of 0.080%), Lebanese (9.5%, a difference of 0.090%), Immigrants from Central America (9.5%, a difference of 0.19%), and Immigrants from Mexico (9.5%, a difference of 0.29%).
| Demographics | Rating | Rank | Unemployment Among Women with Children Ages 6 to 17 years |
| Nicaraguans | 1.0 /100 | #254 | Tragic 9.4% |
| Lithuanians | 0.9 /100 | #255 | Tragic 9.4% |
| Canadians | 0.8 /100 | #256 | Tragic 9.4% |
| Celtics | 0.7 /100 | #257 | Tragic 9.5% |
| Immigrants | Mexico | 0.7 /100 | #258 | Tragic 9.5% |
| Immigrants | Central America | 0.6 /100 | #259 | Tragic 9.5% |
| Italians | 0.6 /100 | #260 | Tragic 9.5% |
| South Americans | 0.5 /100 | #261 | Tragic 9.5% |
| Senegalese | 0.5 /100 | #262 | Tragic 9.5% |
| Lebanese | 0.5 /100 | #263 | Tragic 9.5% |
| Immigrants | Ghana | 0.4 /100 | #264 | Tragic 9.5% |
| West Indians | 0.4 /100 | #265 | Tragic 9.5% |
| Immigrants | Jamaica | 0.3 /100 | #266 | Tragic 9.5% |
| Irish | 0.3 /100 | #267 | Tragic 9.5% |
| Ghanaians | 0.2 /100 | #268 | Tragic 9.6% |