Immigrants from Costa Rica vs Immigrants from Bolivia Unemployment Among Seniors over 65 years
COMPARE
Immigrants from Costa Rica
Immigrants from Bolivia
Unemployment Among Seniors over 65 years
Unemployment Among Seniors over 65 years Comparison
Immigrants from Costa Rica
Immigrants from Bolivia
5.3%
UNEMPLOYMENT AMONG SENIORS OVER 65 YEARS
2.1/ 100
METRIC RATING
236th/ 347
METRIC RANK
5.0%
UNEMPLOYMENT AMONG SENIORS OVER 65 YEARS
97.3/ 100
METRIC RATING
91st/ 347
METRIC RANK
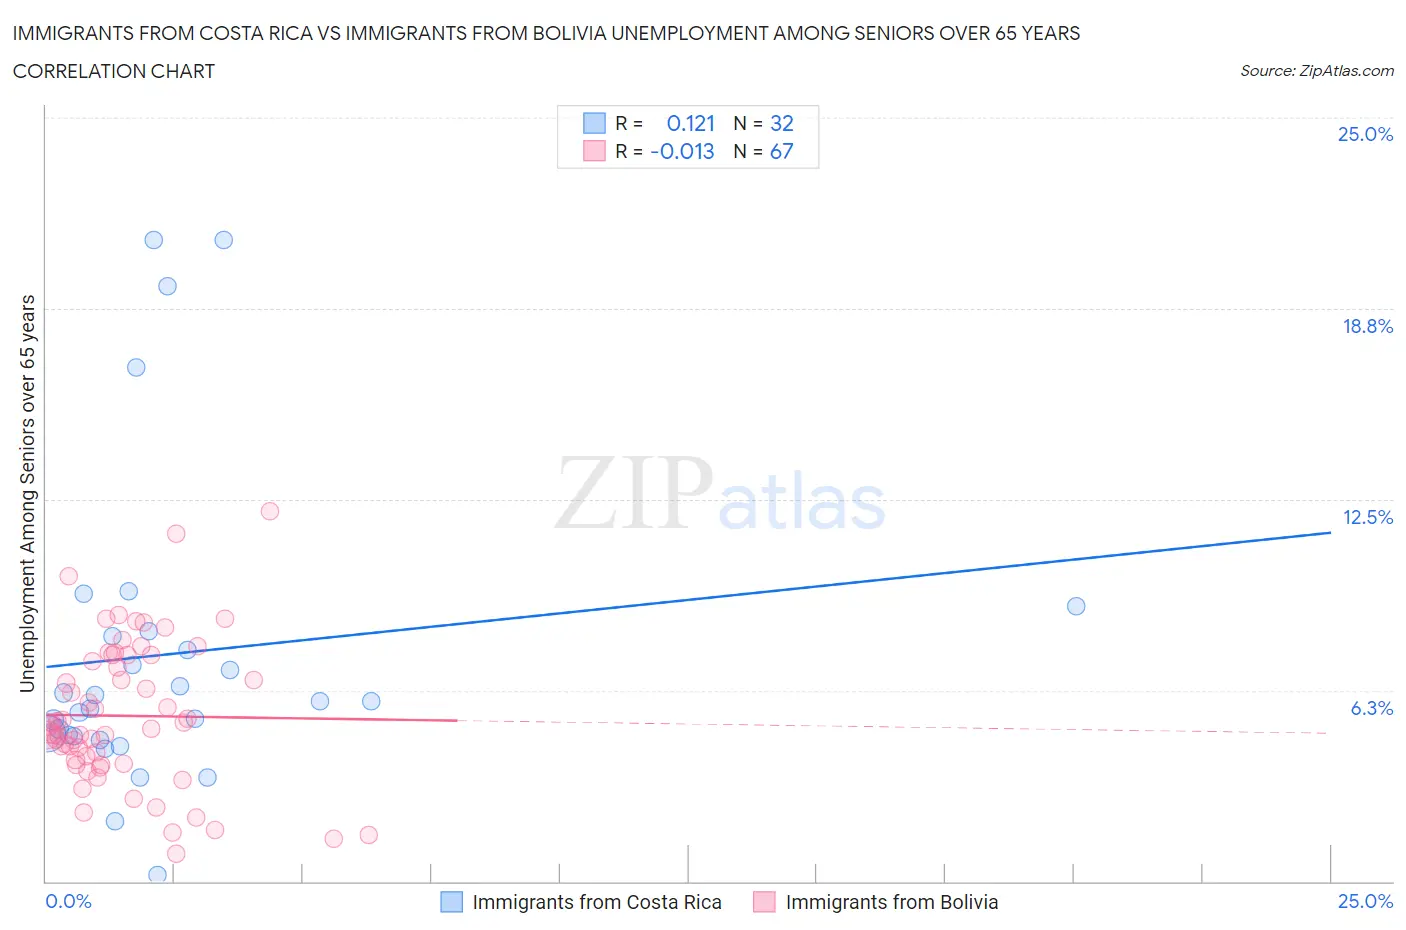
Immigrants from Costa Rica vs Immigrants from Bolivia Unemployment Among Seniors over 65 years Correlation Chart
The statistical analysis conducted on geographies consisting of 195,389,484 people shows a poor positive correlation between the proportion of Immigrants from Costa Rica and unemployment rate amomg seniors over the age of 65 in the United States with a correlation coefficient (R) of 0.121 and weighted average of 5.3%. Similarly, the statistical analysis conducted on geographies consisting of 152,035,484 people shows no correlation between the proportion of Immigrants from Bolivia and unemployment rate amomg seniors over the age of 65 in the United States with a correlation coefficient (R) of -0.013 and weighted average of 5.0%, a difference of 6.1%.
Unemployment Among Seniors over 65 years Correlation Summary
| Measurement | Immigrants from Costa Rica | Immigrants from Bolivia |
| Minimum | 0.20% | 0.90% |
| Maximum | 21.0% | 12.1% |
| Range | 20.8% | 11.2% |
| Mean | 7.4% | 5.4% |
| Median | 5.9% | 5.0% |
| Interquartile 25% (IQ1) | 4.8% | 3.9% |
| Interquartile 75% (IQ3) | 8.1% | 7.4% |
| Interquartile Range (IQR) | 3.3% | 3.5% |
| Standard Deviation (Sample) | 5.1% | 2.4% |
| Standard Deviation (Population) | 5.0% | 2.3% |
Similar Demographics by Unemployment Among Seniors over 65 years
Demographics Similar to Immigrants from Costa Rica by Unemployment Among Seniors over 65 years
In terms of unemployment among seniors over 65 years, the demographic groups most similar to Immigrants from Costa Rica are Immigrants from Greece (5.3%, a difference of 0.060%), Immigrants from Israel (5.3%, a difference of 0.070%), Immigrants from Senegal (5.3%, a difference of 0.13%), Immigrants from Albania (5.3%, a difference of 0.19%), and Immigrants from Trinidad and Tobago (5.3%, a difference of 0.24%).
| Demographics | Rating | Rank | Unemployment Among Seniors over 65 years |
| Samoans | 4.2 /100 | #229 | Tragic 5.3% |
| Immigrants | Argentina | 4.0 /100 | #230 | Tragic 5.3% |
| Hungarians | 3.9 /100 | #231 | Tragic 5.3% |
| Hopi | 3.5 /100 | #232 | Tragic 5.3% |
| Marshallese | 3.1 /100 | #233 | Tragic 5.3% |
| Blackfeet | 3.1 /100 | #234 | Tragic 5.3% |
| Immigrants | Albania | 2.7 /100 | #235 | Tragic 5.3% |
| Immigrants | Costa Rica | 2.1 /100 | #236 | Tragic 5.3% |
| Immigrants | Greece | 2.0 /100 | #237 | Tragic 5.3% |
| Immigrants | Israel | 2.0 /100 | #238 | Tragic 5.3% |
| Immigrants | Senegal | 1.8 /100 | #239 | Tragic 5.3% |
| Immigrants | Trinidad and Tobago | 1.6 /100 | #240 | Tragic 5.3% |
| Apache | 1.3 /100 | #241 | Tragic 5.3% |
| Bahamians | 0.9 /100 | #242 | Tragic 5.3% |
| Nigerians | 0.9 /100 | #243 | Tragic 5.3% |
Demographics Similar to Immigrants from Bolivia by Unemployment Among Seniors over 65 years
In terms of unemployment among seniors over 65 years, the demographic groups most similar to Immigrants from Bolivia are Immigrants from Bulgaria (5.0%, a difference of 0.020%), Austrian (5.0%, a difference of 0.020%), Immigrants from South Africa (5.0%, a difference of 0.080%), Immigrants from South Central Asia (5.0%, a difference of 0.090%), and Afghan (5.0%, a difference of 0.10%).
| Demographics | Rating | Rank | Unemployment Among Seniors over 65 years |
| Filipinos | 98.3 /100 | #84 | Exceptional 5.0% |
| Immigrants | Hungary | 98.2 /100 | #85 | Exceptional 5.0% |
| Immigrants | Taiwan | 98.2 /100 | #86 | Exceptional 5.0% |
| Immigrants | Switzerland | 98.2 /100 | #87 | Exceptional 5.0% |
| Afghans | 97.6 /100 | #88 | Exceptional 5.0% |
| Immigrants | South Central Asia | 97.6 /100 | #89 | Exceptional 5.0% |
| Immigrants | South Africa | 97.6 /100 | #90 | Exceptional 5.0% |
| Immigrants | Bolivia | 97.3 /100 | #91 | Exceptional 5.0% |
| Immigrants | Bulgaria | 97.3 /100 | #92 | Exceptional 5.0% |
| Austrians | 97.3 /100 | #93 | Exceptional 5.0% |
| Burmese | 96.8 /100 | #94 | Exceptional 5.0% |
| Assyrians/Chaldeans/Syriacs | 96.8 /100 | #95 | Exceptional 5.0% |
| Immigrants | Singapore | 96.8 /100 | #96 | Exceptional 5.0% |
| Immigrants | Oceania | 96.8 /100 | #97 | Exceptional 5.0% |
| Czechoslovakians | 96.7 /100 | #98 | Exceptional 5.0% |