Immigrants from Costa Rica vs Immigrants from Australia Unemployment Among Seniors over 65 years
COMPARE
Immigrants from Costa Rica
Immigrants from Australia
Unemployment Among Seniors over 65 years
Unemployment Among Seniors over 65 years Comparison
Immigrants from Costa Rica
Immigrants from Australia
5.3%
UNEMPLOYMENT AMONG SENIORS OVER 65 YEARS
2.1/ 100
METRIC RATING
236th/ 347
METRIC RANK
5.1%
UNEMPLOYMENT AMONG SENIORS OVER 65 YEARS
85.8/ 100
METRIC RATING
131st/ 347
METRIC RANK
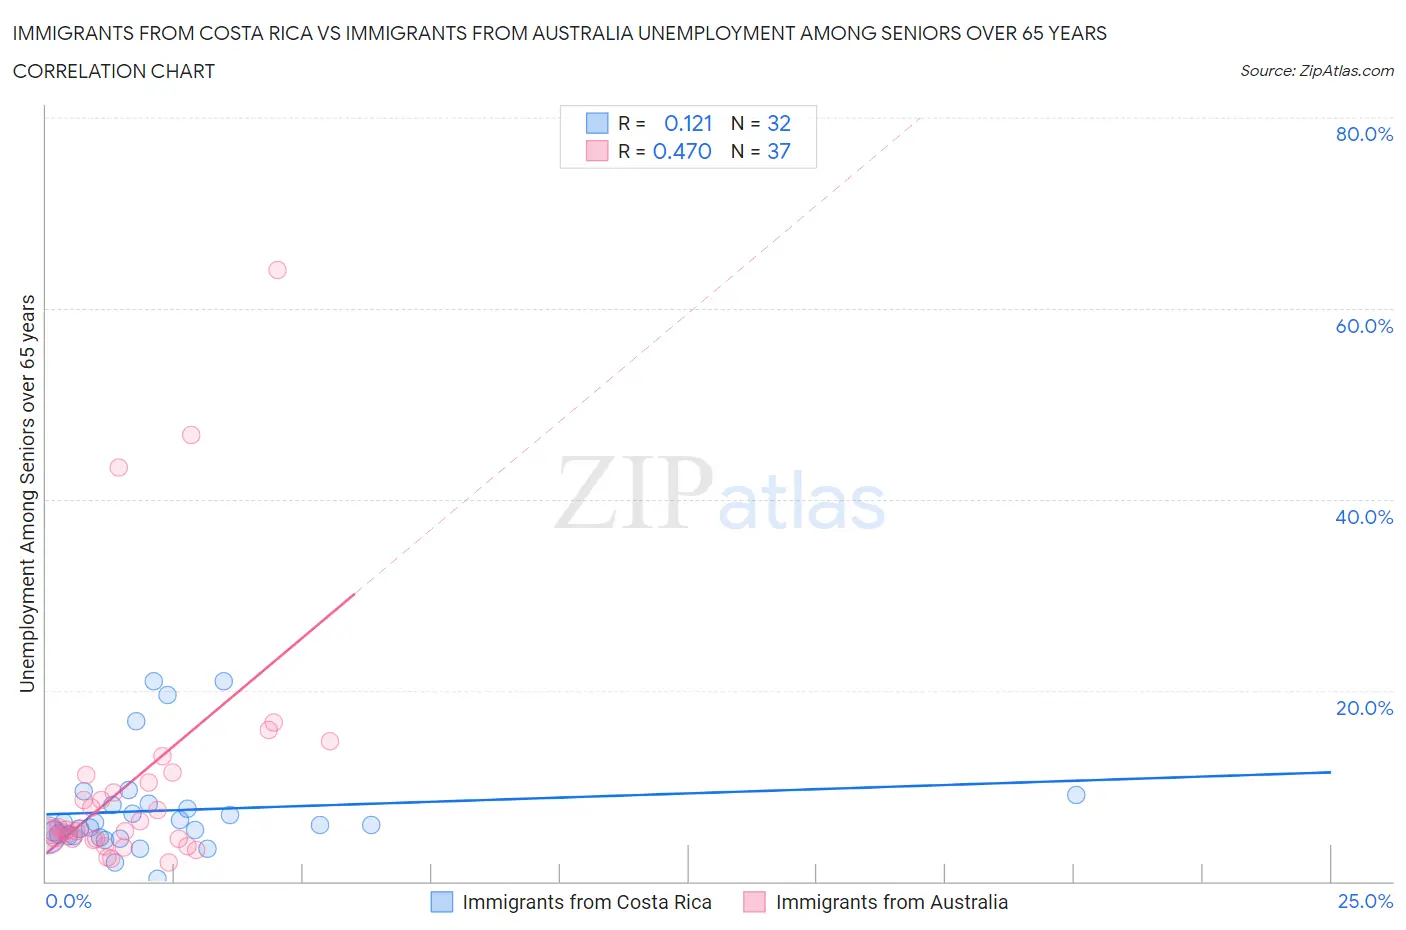
Immigrants from Costa Rica vs Immigrants from Australia Unemployment Among Seniors over 65 years Correlation Chart
The statistical analysis conducted on geographies consisting of 195,389,484 people shows a poor positive correlation between the proportion of Immigrants from Costa Rica and unemployment rate amomg seniors over the age of 65 in the United States with a correlation coefficient (R) of 0.121 and weighted average of 5.3%. Similarly, the statistical analysis conducted on geographies consisting of 213,507,453 people shows a moderate positive correlation between the proportion of Immigrants from Australia and unemployment rate amomg seniors over the age of 65 in the United States with a correlation coefficient (R) of 0.470 and weighted average of 5.1%, a difference of 4.6%.
Unemployment Among Seniors over 65 years Correlation Summary
| Measurement | Immigrants from Costa Rica | Immigrants from Australia |
| Minimum | 0.20% | 1.9% |
| Maximum | 21.0% | 64.0% |
| Range | 20.8% | 62.1% |
| Mean | 7.4% | 10.4% |
| Median | 5.9% | 5.3% |
| Interquartile 25% (IQ1) | 4.8% | 4.5% |
| Interquartile 75% (IQ3) | 8.1% | 10.8% |
| Interquartile Range (IQR) | 3.3% | 6.3% |
| Standard Deviation (Sample) | 5.1% | 13.1% |
| Standard Deviation (Population) | 5.0% | 13.0% |
Similar Demographics by Unemployment Among Seniors over 65 years
Demographics Similar to Immigrants from Costa Rica by Unemployment Among Seniors over 65 years
In terms of unemployment among seniors over 65 years, the demographic groups most similar to Immigrants from Costa Rica are Immigrants from Greece (5.3%, a difference of 0.060%), Immigrants from Israel (5.3%, a difference of 0.070%), Immigrants from Senegal (5.3%, a difference of 0.13%), Immigrants from Albania (5.3%, a difference of 0.19%), and Immigrants from Trinidad and Tobago (5.3%, a difference of 0.24%).
| Demographics | Rating | Rank | Unemployment Among Seniors over 65 years |
| Samoans | 4.2 /100 | #229 | Tragic 5.3% |
| Immigrants | Argentina | 4.0 /100 | #230 | Tragic 5.3% |
| Hungarians | 3.9 /100 | #231 | Tragic 5.3% |
| Hopi | 3.5 /100 | #232 | Tragic 5.3% |
| Marshallese | 3.1 /100 | #233 | Tragic 5.3% |
| Blackfeet | 3.1 /100 | #234 | Tragic 5.3% |
| Immigrants | Albania | 2.7 /100 | #235 | Tragic 5.3% |
| Immigrants | Costa Rica | 2.1 /100 | #236 | Tragic 5.3% |
| Immigrants | Greece | 2.0 /100 | #237 | Tragic 5.3% |
| Immigrants | Israel | 2.0 /100 | #238 | Tragic 5.3% |
| Immigrants | Senegal | 1.8 /100 | #239 | Tragic 5.3% |
| Immigrants | Trinidad and Tobago | 1.6 /100 | #240 | Tragic 5.3% |
| Apache | 1.3 /100 | #241 | Tragic 5.3% |
| Bahamians | 0.9 /100 | #242 | Tragic 5.3% |
| Nigerians | 0.9 /100 | #243 | Tragic 5.3% |
Demographics Similar to Immigrants from Australia by Unemployment Among Seniors over 65 years
In terms of unemployment among seniors over 65 years, the demographic groups most similar to Immigrants from Australia are Chilean (5.1%, a difference of 0.010%), Syrian (5.1%, a difference of 0.030%), Immigrants from England (5.1%, a difference of 0.060%), Iranian (5.1%, a difference of 0.060%), and Turkish (5.1%, a difference of 0.060%).
| Demographics | Rating | Rank | Unemployment Among Seniors over 65 years |
| Immigrants | North America | 87.9 /100 | #124 | Excellent 5.1% |
| Dutch | 87.6 /100 | #125 | Excellent 5.1% |
| Immigrants | Sri Lanka | 87.4 /100 | #126 | Excellent 5.1% |
| Sri Lankans | 87.4 /100 | #127 | Excellent 5.1% |
| Australians | 87.1 /100 | #128 | Excellent 5.1% |
| Immigrants | England | 86.7 /100 | #129 | Excellent 5.1% |
| Iranians | 86.6 /100 | #130 | Excellent 5.1% |
| Immigrants | Australia | 85.8 /100 | #131 | Excellent 5.1% |
| Chileans | 85.6 /100 | #132 | Excellent 5.1% |
| Syrians | 85.3 /100 | #133 | Excellent 5.1% |
| Turks | 84.9 /100 | #134 | Excellent 5.1% |
| Ukrainians | 84.4 /100 | #135 | Excellent 5.1% |
| Whites/Caucasians | 84.4 /100 | #136 | Excellent 5.1% |
| Arabs | 84.3 /100 | #137 | Excellent 5.1% |
| New Zealanders | 83.2 /100 | #138 | Excellent 5.1% |