Immigrants from Colombia vs Immigrants from St. Vincent and the Grenadines Unemployment Among Seniors over 75 years
COMPARE
Immigrants from Colombia
Immigrants from St. Vincent and the Grenadines
Unemployment Among Seniors over 75 years
Unemployment Among Seniors over 75 years Comparison
Immigrants from Colombia
Immigrants from St. Vincent and the Grenadines
8.5%
UNEMPLOYMENT AMONG SENIORS OVER 75 YEARS
85.6/ 100
METRIC RATING
148th/ 347
METRIC RANK
9.8%
UNEMPLOYMENT AMONG SENIORS OVER 75 YEARS
0.0/ 100
METRIC RATING
296th/ 347
METRIC RANK
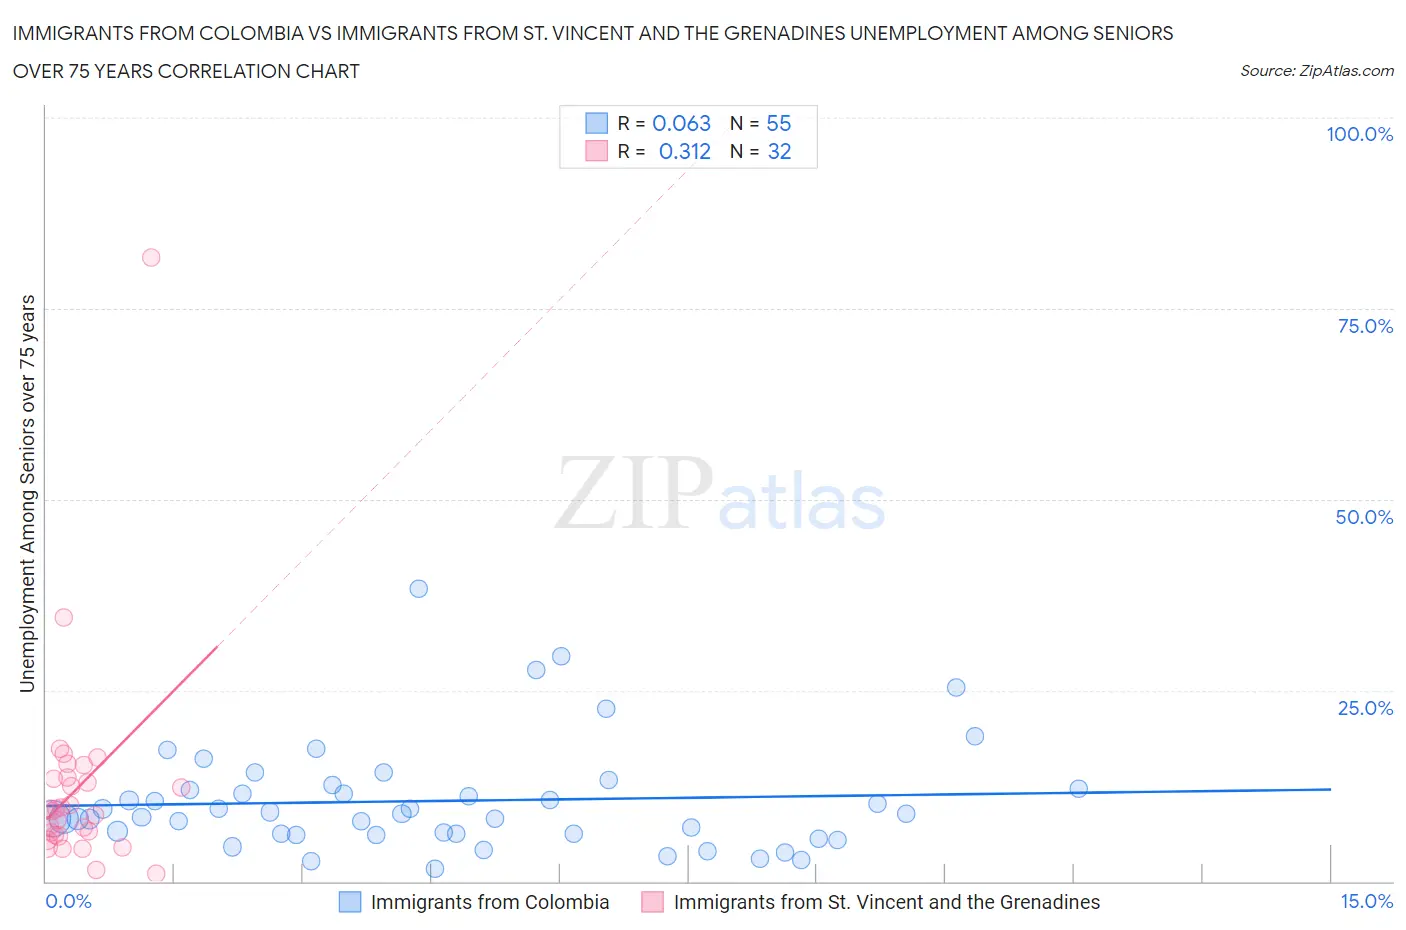
Immigrants from Colombia vs Immigrants from St. Vincent and the Grenadines Unemployment Among Seniors over 75 years Correlation Chart
The statistical analysis conducted on geographies consisting of 196,733,881 people shows a slight positive correlation between the proportion of Immigrants from Colombia and unemployment rate among seniors over the age of 75 in the United States with a correlation coefficient (R) of 0.063 and weighted average of 8.5%. Similarly, the statistical analysis conducted on geographies consisting of 44,044,285 people shows a mild positive correlation between the proportion of Immigrants from St. Vincent and the Grenadines and unemployment rate among seniors over the age of 75 in the United States with a correlation coefficient (R) of 0.312 and weighted average of 9.8%, a difference of 15.2%.
Unemployment Among Seniors over 75 years Correlation Summary
| Measurement | Immigrants from Colombia | Immigrants from St. Vincent and the Grenadines |
| Minimum | 1.6% | 1.0% |
| Maximum | 38.3% | 81.7% |
| Range | 36.7% | 80.7% |
| Mean | 10.5% | 12.2% |
| Median | 8.8% | 9.3% |
| Interquartile 25% (IQ1) | 6.2% | 6.0% |
| Interquartile 75% (IQ3) | 12.1% | 13.5% |
| Interquartile Range (IQR) | 5.9% | 7.5% |
| Standard Deviation (Sample) | 7.1% | 14.2% |
| Standard Deviation (Population) | 7.1% | 13.9% |
Similar Demographics by Unemployment Among Seniors over 75 years
Demographics Similar to Immigrants from Colombia by Unemployment Among Seniors over 75 years
In terms of unemployment among seniors over 75 years, the demographic groups most similar to Immigrants from Colombia are Immigrants from Sierra Leone (8.5%, a difference of 0.0%), Immigrants from South Eastern Asia (8.5%, a difference of 0.020%), Immigrants from Romania (8.5%, a difference of 0.070%), Immigrants from Ecuador (8.5%, a difference of 0.11%), and Colombian (8.5%, a difference of 0.13%).
| Demographics | Rating | Rank | Unemployment Among Seniors over 75 years |
| Immigrants | Bolivia | 87.9 /100 | #141 | Excellent 8.5% |
| Immigrants | Ukraine | 87.0 /100 | #142 | Excellent 8.5% |
| Immigrants | Costa Rica | 86.8 /100 | #143 | Excellent 8.5% |
| Colombians | 86.7 /100 | #144 | Excellent 8.5% |
| Immigrants | Romania | 86.2 /100 | #145 | Excellent 8.5% |
| Immigrants | South Eastern Asia | 85.8 /100 | #146 | Excellent 8.5% |
| Immigrants | Sierra Leone | 85.6 /100 | #147 | Excellent 8.5% |
| Immigrants | Colombia | 85.6 /100 | #148 | Excellent 8.5% |
| Immigrants | Ecuador | 84.6 /100 | #149 | Excellent 8.5% |
| Paiute | 82.5 /100 | #150 | Excellent 8.6% |
| Immigrants | Bosnia and Herzegovina | 80.6 /100 | #151 | Excellent 8.6% |
| Latvians | 80.5 /100 | #152 | Excellent 8.6% |
| Mongolians | 80.1 /100 | #153 | Excellent 8.6% |
| Immigrants | Pakistan | 79.7 /100 | #154 | Good 8.6% |
| Ecuadorians | 78.5 /100 | #155 | Good 8.6% |
Demographics Similar to Immigrants from St. Vincent and the Grenadines by Unemployment Among Seniors over 75 years
In terms of unemployment among seniors over 75 years, the demographic groups most similar to Immigrants from St. Vincent and the Grenadines are Nonimmigrants (9.8%, a difference of 0.050%), Cherokee (9.8%, a difference of 0.080%), Immigrants from Dominica (9.8%, a difference of 0.41%), Lithuanian (9.9%, a difference of 0.46%), and Norwegian (9.8%, a difference of 0.47%).
| Demographics | Rating | Rank | Unemployment Among Seniors over 75 years |
| Czechs | 0.0 /100 | #289 | Tragic 9.7% |
| Sioux | 0.0 /100 | #290 | Tragic 9.7% |
| Scandinavians | 0.0 /100 | #291 | Tragic 9.7% |
| Immigrants | Western Africa | 0.0 /100 | #292 | Tragic 9.8% |
| Norwegians | 0.0 /100 | #293 | Tragic 9.8% |
| Immigrants | Dominica | 0.0 /100 | #294 | Tragic 9.8% |
| Immigrants | Nonimmigrants | 0.0 /100 | #295 | Tragic 9.8% |
| Immigrants | St. Vincent and the Grenadines | 0.0 /100 | #296 | Tragic 9.8% |
| Cherokee | 0.0 /100 | #297 | Tragic 9.8% |
| Lithuanians | 0.0 /100 | #298 | Tragic 9.9% |
| Belgians | 0.0 /100 | #299 | Tragic 9.9% |
| Iraqis | 0.0 /100 | #300 | Tragic 9.9% |
| Welsh | 0.0 /100 | #301 | Tragic 10.0% |
| Finns | 0.0 /100 | #302 | Tragic 10.0% |
| Puget Sound Salish | 0.0 /100 | #303 | Tragic 10.0% |