Haitian vs Immigrants from St. Vincent and the Grenadines Unemployment Among Seniors over 75 years
COMPARE
Haitian
Immigrants from St. Vincent and the Grenadines
Unemployment Among Seniors over 75 years
Unemployment Among Seniors over 75 years Comparison
Haitians
Immigrants from St. Vincent and the Grenadines
8.5%
UNEMPLOYMENT AMONG SENIORS OVER 75 YEARS
91.4/ 100
METRIC RATING
135th/ 347
METRIC RANK
9.8%
UNEMPLOYMENT AMONG SENIORS OVER 75 YEARS
0.0/ 100
METRIC RATING
296th/ 347
METRIC RANK
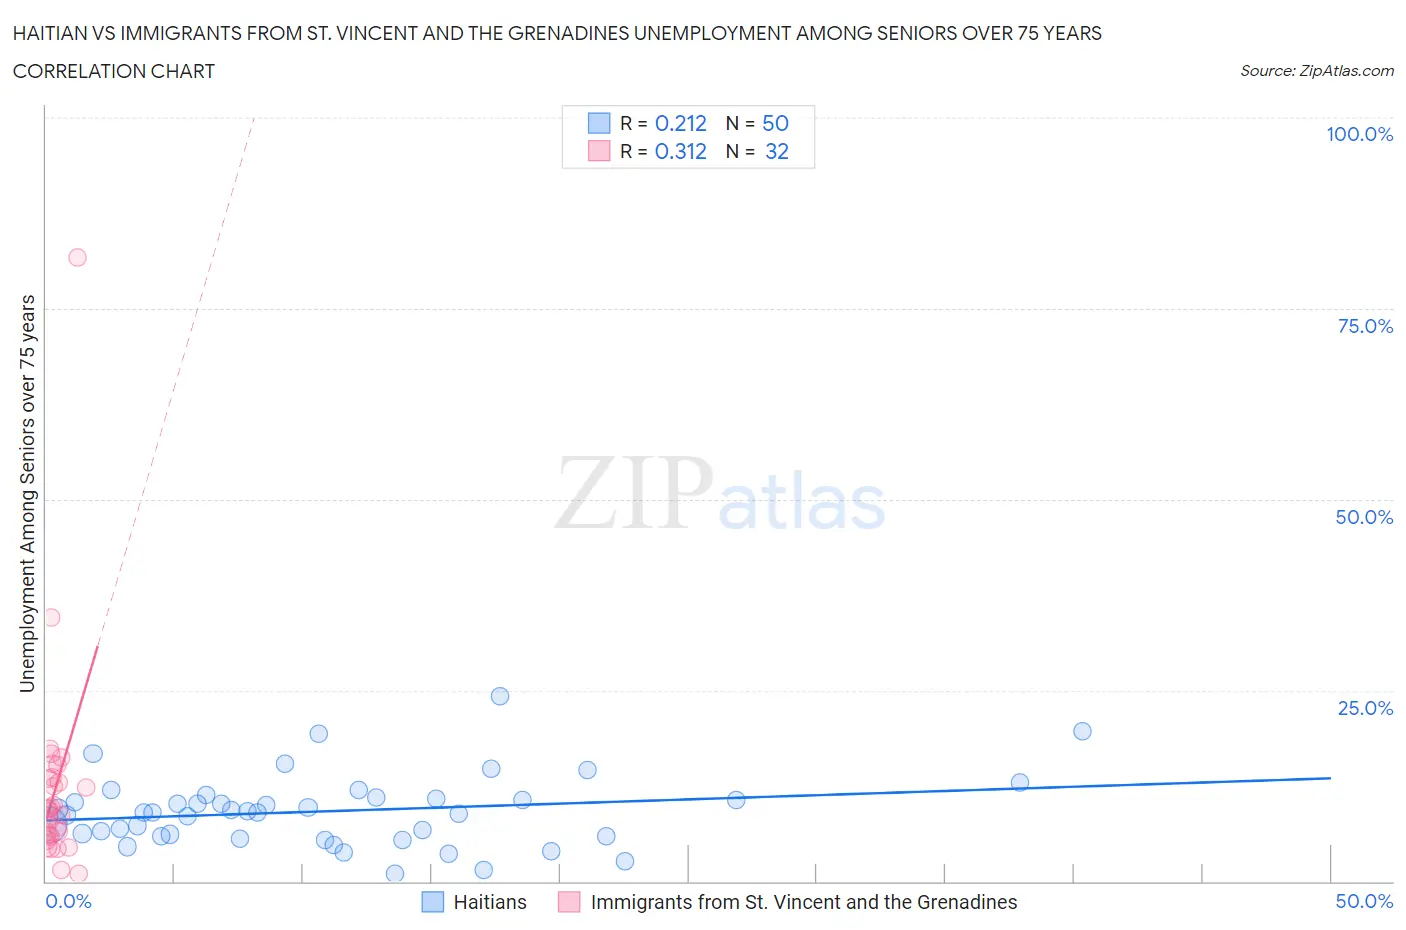
Haitian vs Immigrants from St. Vincent and the Grenadines Unemployment Among Seniors over 75 years Correlation Chart
The statistical analysis conducted on geographies consisting of 162,149,753 people shows a weak positive correlation between the proportion of Haitians and unemployment rate among seniors over the age of 75 in the United States with a correlation coefficient (R) of 0.212 and weighted average of 8.5%. Similarly, the statistical analysis conducted on geographies consisting of 44,044,285 people shows a mild positive correlation between the proportion of Immigrants from St. Vincent and the Grenadines and unemployment rate among seniors over the age of 75 in the United States with a correlation coefficient (R) of 0.312 and weighted average of 9.8%, a difference of 16.2%.
Unemployment Among Seniors over 75 years Correlation Summary
| Measurement | Haitian | Immigrants from St. Vincent and the Grenadines |
| Minimum | 1.1% | 1.0% |
| Maximum | 24.2% | 81.7% |
| Range | 23.1% | 80.7% |
| Mean | 9.2% | 12.2% |
| Median | 9.0% | 9.3% |
| Interquartile 25% (IQ1) | 5.9% | 6.0% |
| Interquartile 75% (IQ3) | 10.9% | 13.5% |
| Interquartile Range (IQR) | 5.0% | 7.5% |
| Standard Deviation (Sample) | 4.6% | 14.2% |
| Standard Deviation (Population) | 4.6% | 13.9% |
Similar Demographics by Unemployment Among Seniors over 75 years
Demographics Similar to Haitians by Unemployment Among Seniors over 75 years
In terms of unemployment among seniors over 75 years, the demographic groups most similar to Haitians are Immigrants from Trinidad and Tobago (8.5%, a difference of 0.11%), Immigrants from Kuwait (8.5%, a difference of 0.15%), Immigrants from Bulgaria (8.5%, a difference of 0.29%), Immigrants from Czechoslovakia (8.4%, a difference of 0.39%), and Barbadian (8.5%, a difference of 0.44%).
| Demographics | Rating | Rank | Unemployment Among Seniors over 75 years |
| Native Hawaiians | 96.1 /100 | #128 | Exceptional 8.4% |
| Ghanaians | 96.0 /100 | #129 | Exceptional 8.4% |
| Apache | 95.2 /100 | #130 | Exceptional 8.4% |
| German Russians | 94.9 /100 | #131 | Exceptional 8.4% |
| Chileans | 93.8 /100 | #132 | Exceptional 8.4% |
| Serbians | 93.7 /100 | #133 | Exceptional 8.4% |
| Immigrants | Czechoslovakia | 93.4 /100 | #134 | Exceptional 8.4% |
| Haitians | 91.4 /100 | #135 | Exceptional 8.5% |
| Immigrants | Trinidad and Tobago | 90.8 /100 | #136 | Exceptional 8.5% |
| Immigrants | Kuwait | 90.5 /100 | #137 | Exceptional 8.5% |
| Immigrants | Bulgaria | 89.6 /100 | #138 | Excellent 8.5% |
| Barbadians | 88.6 /100 | #139 | Excellent 8.5% |
| South Americans | 87.9 /100 | #140 | Excellent 8.5% |
| Immigrants | Bolivia | 87.9 /100 | #141 | Excellent 8.5% |
| Immigrants | Ukraine | 87.0 /100 | #142 | Excellent 8.5% |
Demographics Similar to Immigrants from St. Vincent and the Grenadines by Unemployment Among Seniors over 75 years
In terms of unemployment among seniors over 75 years, the demographic groups most similar to Immigrants from St. Vincent and the Grenadines are Nonimmigrants (9.8%, a difference of 0.050%), Cherokee (9.8%, a difference of 0.080%), Immigrants from Dominica (9.8%, a difference of 0.41%), Lithuanian (9.9%, a difference of 0.46%), and Norwegian (9.8%, a difference of 0.47%).
| Demographics | Rating | Rank | Unemployment Among Seniors over 75 years |
| Czechs | 0.0 /100 | #289 | Tragic 9.7% |
| Sioux | 0.0 /100 | #290 | Tragic 9.7% |
| Scandinavians | 0.0 /100 | #291 | Tragic 9.7% |
| Immigrants | Western Africa | 0.0 /100 | #292 | Tragic 9.8% |
| Norwegians | 0.0 /100 | #293 | Tragic 9.8% |
| Immigrants | Dominica | 0.0 /100 | #294 | Tragic 9.8% |
| Immigrants | Nonimmigrants | 0.0 /100 | #295 | Tragic 9.8% |
| Immigrants | St. Vincent and the Grenadines | 0.0 /100 | #296 | Tragic 9.8% |
| Cherokee | 0.0 /100 | #297 | Tragic 9.8% |
| Lithuanians | 0.0 /100 | #298 | Tragic 9.9% |
| Belgians | 0.0 /100 | #299 | Tragic 9.9% |
| Iraqis | 0.0 /100 | #300 | Tragic 9.9% |
| Welsh | 0.0 /100 | #301 | Tragic 10.0% |
| Finns | 0.0 /100 | #302 | Tragic 10.0% |
| Puget Sound Salish | 0.0 /100 | #303 | Tragic 10.0% |