Immigrants from China vs Fijian Unemployment Among Youth under 25 years
COMPARE
Immigrants from China
Fijian
Unemployment Among Youth under 25 years
Unemployment Among Youth under 25 years Comparison
Immigrants from China
Fijians
11.6%
UNEMPLOYMENT AMONG YOUTH UNDER 25 YEARS
50.0/ 100
METRIC RATING
174th/ 347
METRIC RANK
11.3%
UNEMPLOYMENT AMONG YOUTH UNDER 25 YEARS
90.2/ 100
METRIC RATING
113th/ 347
METRIC RANK
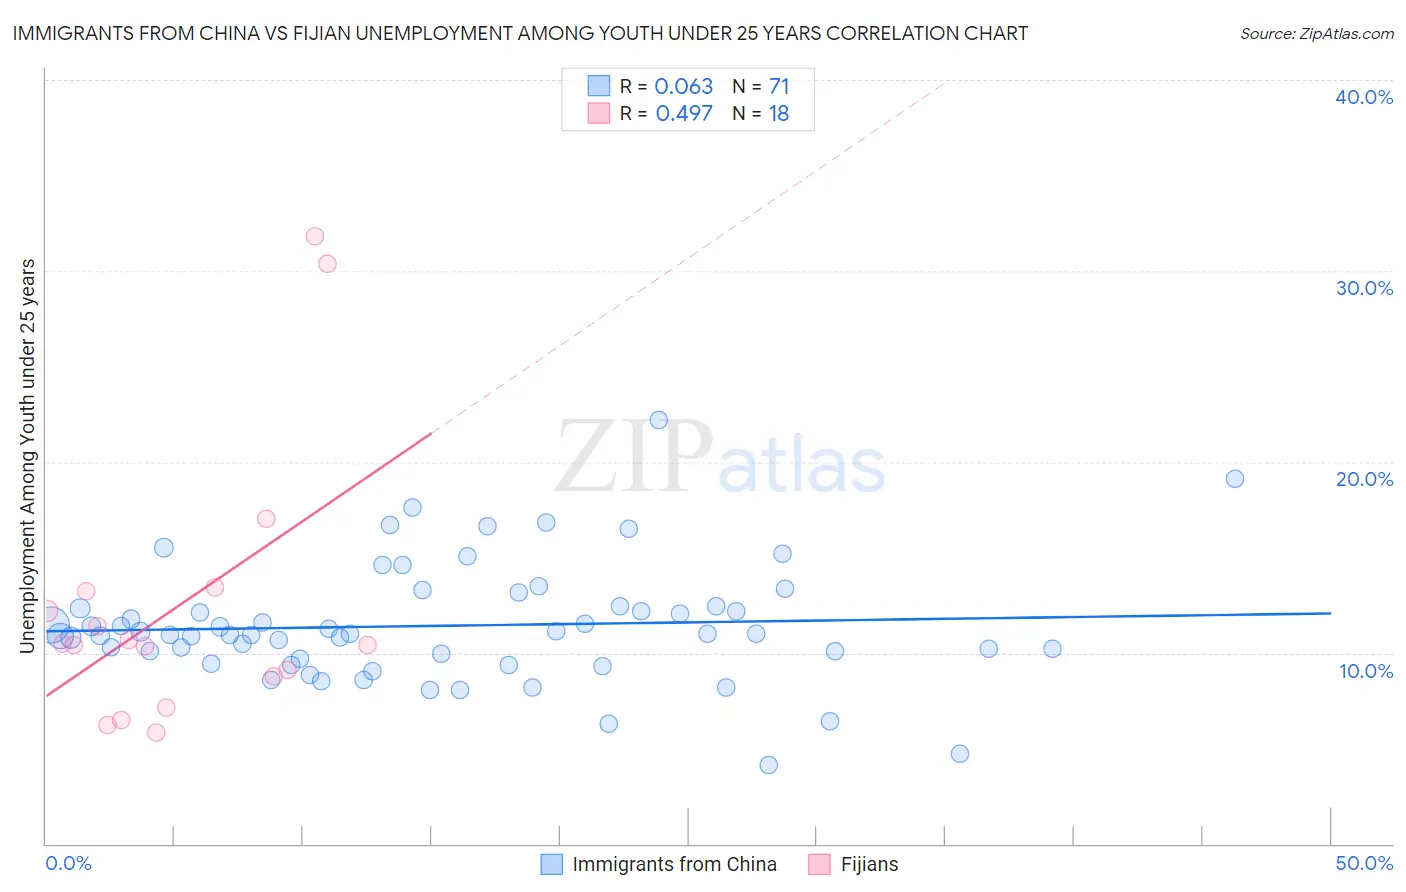
Immigrants from China vs Fijian Unemployment Among Youth under 25 years Correlation Chart
The statistical analysis conducted on geographies consisting of 450,048,197 people shows a slight positive correlation between the proportion of Immigrants from China and unemployment rate among youth under the age of 25 in the United States with a correlation coefficient (R) of 0.063 and weighted average of 11.6%. Similarly, the statistical analysis conducted on geographies consisting of 55,769,813 people shows a moderate positive correlation between the proportion of Fijians and unemployment rate among youth under the age of 25 in the United States with a correlation coefficient (R) of 0.497 and weighted average of 11.3%, a difference of 2.3%.
Unemployment Among Youth under 25 years Correlation Summary
| Measurement | Immigrants from China | Fijian |
| Minimum | 4.1% | 5.8% |
| Maximum | 22.2% | 31.8% |
| Range | 18.1% | 26.0% |
| Mean | 11.4% | 12.5% |
| Median | 11.0% | 10.5% |
| Interquartile 25% (IQ1) | 9.7% | 8.8% |
| Interquartile 75% (IQ3) | 12.4% | 13.2% |
| Interquartile Range (IQR) | 2.7% | 4.4% |
| Standard Deviation (Sample) | 3.1% | 7.3% |
| Standard Deviation (Population) | 3.1% | 7.1% |
Similar Demographics by Unemployment Among Youth under 25 years
Demographics Similar to Immigrants from China by Unemployment Among Youth under 25 years
In terms of unemployment among youth under 25 years, the demographic groups most similar to Immigrants from China are Immigrants from South Eastern Asia (11.6%, a difference of 0.070%), Immigrants from Iraq (11.6%, a difference of 0.12%), Ugandan (11.6%, a difference of 0.18%), Immigrants from Morocco (11.6%, a difference of 0.21%), and Immigrants from Denmark (11.6%, a difference of 0.21%).
| Demographics | Rating | Rank | Unemployment Among Youth under 25 years |
| Okinawans | 58.7 /100 | #167 | Average 11.6% |
| Potawatomi | 57.9 /100 | #168 | Average 11.6% |
| Eastern Europeans | 57.5 /100 | #169 | Average 11.6% |
| Russians | 57.3 /100 | #170 | Average 11.6% |
| Bangladeshis | 55.6 /100 | #171 | Average 11.6% |
| Immigrants | Morocco | 55.1 /100 | #172 | Average 11.6% |
| Immigrants | South Eastern Asia | 51.7 /100 | #173 | Average 11.6% |
| Immigrants | China | 50.0 /100 | #174 | Average 11.6% |
| Immigrants | Iraq | 47.0 /100 | #175 | Average 11.6% |
| Ugandans | 45.6 /100 | #176 | Average 11.6% |
| Immigrants | Denmark | 45.0 /100 | #177 | Average 11.6% |
| Immigrants | Europe | 42.4 /100 | #178 | Average 11.6% |
| Immigrants | Hong Kong | 42.4 /100 | #179 | Average 11.6% |
| Spaniards | 39.8 /100 | #180 | Fair 11.7% |
| Syrians | 38.4 /100 | #181 | Fair 11.7% |
Demographics Similar to Fijians by Unemployment Among Youth under 25 years
In terms of unemployment among youth under 25 years, the demographic groups most similar to Fijians are Immigrants from France (11.3%, a difference of 0.010%), Immigrants from Austria (11.3%, a difference of 0.010%), Immigrants from Ethiopia (11.3%, a difference of 0.040%), Immigrants from Vietnam (11.3%, a difference of 0.050%), and Burmese (11.3%, a difference of 0.050%).
| Demographics | Rating | Rank | Unemployment Among Youth under 25 years |
| Chileans | 93.0 /100 | #106 | Exceptional 11.3% |
| Immigrants | Lithuania | 92.9 /100 | #107 | Exceptional 11.3% |
| Immigrants | Kuwait | 92.9 /100 | #108 | Exceptional 11.3% |
| Iranians | 92.0 /100 | #109 | Exceptional 11.3% |
| Immigrants | Norway | 91.5 /100 | #110 | Exceptional 11.3% |
| Immigrants | France | 90.3 /100 | #111 | Exceptional 11.3% |
| Immigrants | Austria | 90.3 /100 | #112 | Exceptional 11.3% |
| Fijians | 90.2 /100 | #113 | Exceptional 11.3% |
| Immigrants | Ethiopia | 89.9 /100 | #114 | Excellent 11.3% |
| Immigrants | Vietnam | 89.9 /100 | #115 | Excellent 11.3% |
| Burmese | 89.8 /100 | #116 | Excellent 11.3% |
| Sri Lankans | 89.8 /100 | #117 | Excellent 11.3% |
| Afghans | 89.7 /100 | #118 | Excellent 11.3% |
| Immigrants | Scotland | 89.2 /100 | #119 | Excellent 11.4% |
| Malaysians | 89.0 /100 | #120 | Excellent 11.4% |