Immigrants from China vs Armenian Unemployment Among Ages 45 to 54 years
COMPARE
Immigrants from China
Armenian
Unemployment Among Ages 45 to 54 years
Unemployment Among Ages 45 to 54 years Comparison
Immigrants from China
Armenians
4.5%
UNEMPLOYMENT AMONG AGES 45 TO 54 YEARS
46.7/ 100
METRIC RATING
182nd/ 347
METRIC RANK
5.2%
UNEMPLOYMENT AMONG AGES 45 TO 54 YEARS
0.0/ 100
METRIC RATING
291st/ 347
METRIC RANK
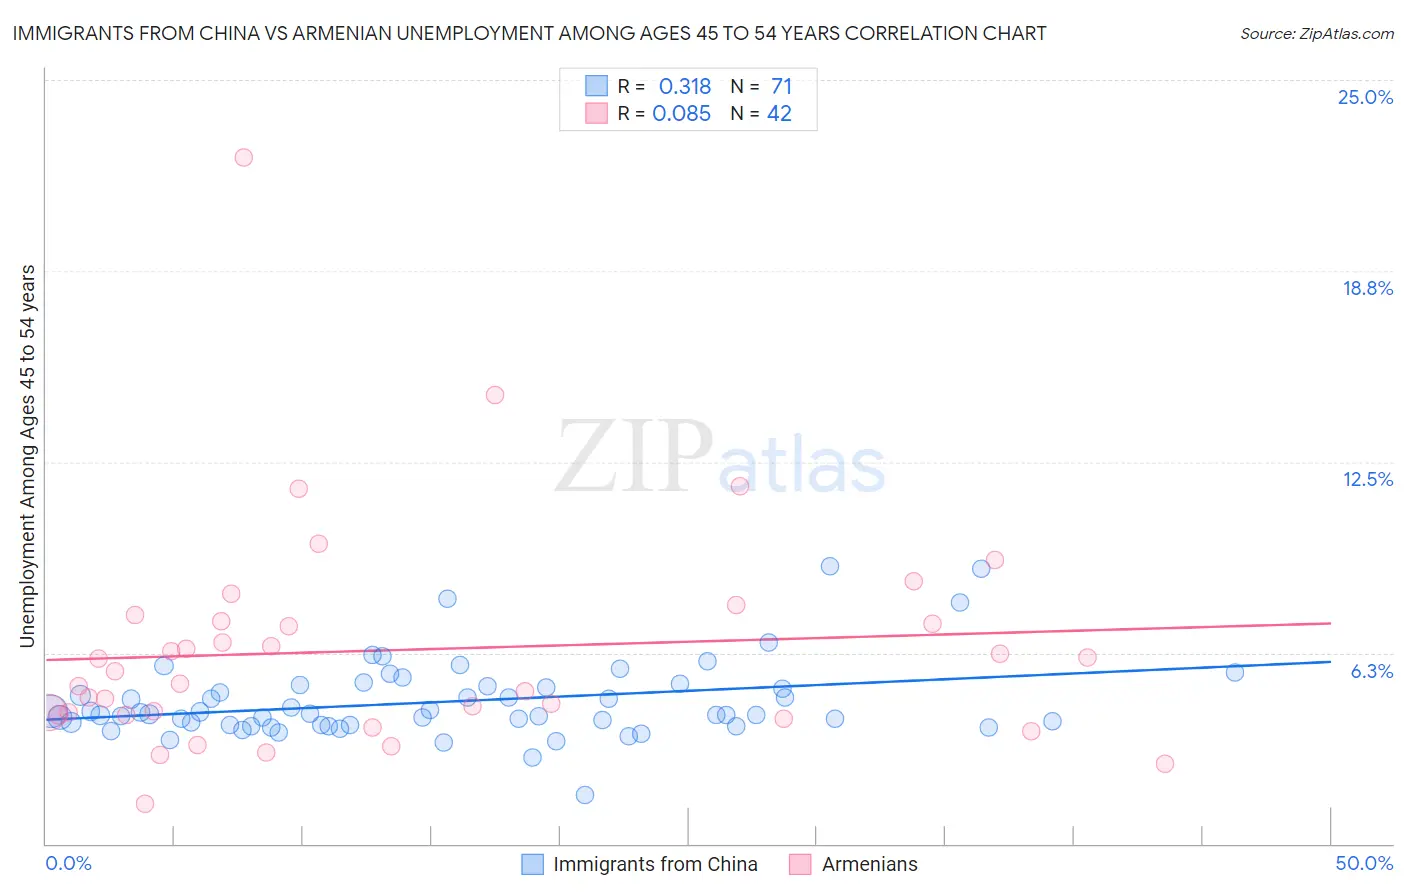
Immigrants from China vs Armenian Unemployment Among Ages 45 to 54 years Correlation Chart
The statistical analysis conducted on geographies consisting of 442,180,379 people shows a mild positive correlation between the proportion of Immigrants from China and unemployment rate among population between the ages 45 and 54 in the United States with a correlation coefficient (R) of 0.318 and weighted average of 4.5%. Similarly, the statistical analysis conducted on geographies consisting of 304,943,132 people shows a slight positive correlation between the proportion of Armenians and unemployment rate among population between the ages 45 and 54 in the United States with a correlation coefficient (R) of 0.085 and weighted average of 5.2%, a difference of 14.9%.
Unemployment Among Ages 45 to 54 years Correlation Summary
| Measurement | Immigrants from China | Armenian |
| Minimum | 1.6% | 1.3% |
| Maximum | 9.1% | 22.5% |
| Range | 7.5% | 21.1% |
| Mean | 4.6% | 6.3% |
| Median | 4.2% | 5.4% |
| Interquartile 25% (IQ1) | 3.9% | 4.2% |
| Interquartile 75% (IQ3) | 5.2% | 7.3% |
| Interquartile Range (IQR) | 1.3% | 3.1% |
| Standard Deviation (Sample) | 1.3% | 3.7% |
| Standard Deviation (Population) | 1.3% | 3.6% |
Similar Demographics by Unemployment Among Ages 45 to 54 years
Demographics Similar to Immigrants from China by Unemployment Among Ages 45 to 54 years
In terms of unemployment among ages 45 to 54 years, the demographic groups most similar to Immigrants from China are Sierra Leonean (4.5%, a difference of 0.0%), Immigrants from Poland (4.5%, a difference of 0.010%), Malaysian (4.5%, a difference of 0.030%), Immigrants from Hong Kong (4.5%, a difference of 0.040%), and Immigrants from Russia (4.5%, a difference of 0.070%).
| Demographics | Rating | Rank | Unemployment Among Ages 45 to 54 years |
| Immigrants | France | 49.4 /100 | #175 | Average 4.5% |
| Puget Sound Salish | 49.1 /100 | #176 | Average 4.5% |
| Immigrants | Northern Africa | 49.0 /100 | #177 | Average 4.5% |
| Immigrants | Australia | 48.5 /100 | #178 | Average 4.5% |
| Immigrants | Russia | 48.2 /100 | #179 | Average 4.5% |
| Malaysians | 47.5 /100 | #180 | Average 4.5% |
| Immigrants | Poland | 47.0 /100 | #181 | Average 4.5% |
| Immigrants | China | 46.7 /100 | #182 | Average 4.5% |
| Sierra Leoneans | 46.7 /100 | #183 | Average 4.5% |
| Immigrants | Hong Kong | 45.9 /100 | #184 | Average 4.5% |
| Immigrants | Philippines | 41.0 /100 | #185 | Average 4.5% |
| Hawaiians | 39.1 /100 | #186 | Fair 4.5% |
| Immigrants | Ukraine | 36.8 /100 | #187 | Fair 4.5% |
| Immigrants | Sierra Leone | 36.3 /100 | #188 | Fair 4.6% |
| Immigrants | Laos | 35.7 /100 | #189 | Fair 4.6% |
Demographics Similar to Armenians by Unemployment Among Ages 45 to 54 years
In terms of unemployment among ages 45 to 54 years, the demographic groups most similar to Armenians are Immigrants from Portugal (5.2%, a difference of 0.0%), Immigrants from Haiti (5.2%, a difference of 0.17%), Trinidadian and Tobagonian (5.2%, a difference of 0.24%), Immigrants from Senegal (5.2%, a difference of 0.25%), and Immigrants from Caribbean (5.2%, a difference of 0.56%).
| Demographics | Rating | Rank | Unemployment Among Ages 45 to 54 years |
| Kiowa | 0.0 /100 | #284 | Tragic 5.1% |
| Iroquois | 0.0 /100 | #285 | Tragic 5.1% |
| Senegalese | 0.0 /100 | #286 | Tragic 5.1% |
| Haitians | 0.0 /100 | #287 | Tragic 5.2% |
| Immigrants | Caribbean | 0.0 /100 | #288 | Tragic 5.2% |
| Immigrants | Haiti | 0.0 /100 | #289 | Tragic 5.2% |
| Immigrants | Portugal | 0.0 /100 | #290 | Tragic 5.2% |
| Armenians | 0.0 /100 | #291 | Tragic 5.2% |
| Trinidadians and Tobagonians | 0.0 /100 | #292 | Tragic 5.2% |
| Immigrants | Senegal | 0.0 /100 | #293 | Tragic 5.2% |
| Belizeans | 0.0 /100 | #294 | Tragic 5.2% |
| Jamaicans | 0.0 /100 | #295 | Tragic 5.3% |
| Aleuts | 0.0 /100 | #296 | Tragic 5.3% |
| West Indians | 0.0 /100 | #297 | Tragic 5.3% |
| Immigrants | Trinidad and Tobago | 0.0 /100 | #298 | Tragic 5.3% |