Immigrants from Caribbean vs Danish Unemployment Among Seniors over 65 years
COMPARE
Immigrants from Caribbean
Danish
Unemployment Among Seniors over 65 years
Unemployment Among Seniors over 65 years Comparison
Immigrants from Caribbean
Danes
5.3%
UNEMPLOYMENT AMONG SENIORS OVER 65 YEARS
0.7/ 100
METRIC RATING
247th/ 347
METRIC RANK
4.9%
UNEMPLOYMENT AMONG SENIORS OVER 65 YEARS
99.8/ 100
METRIC RATING
57th/ 347
METRIC RANK
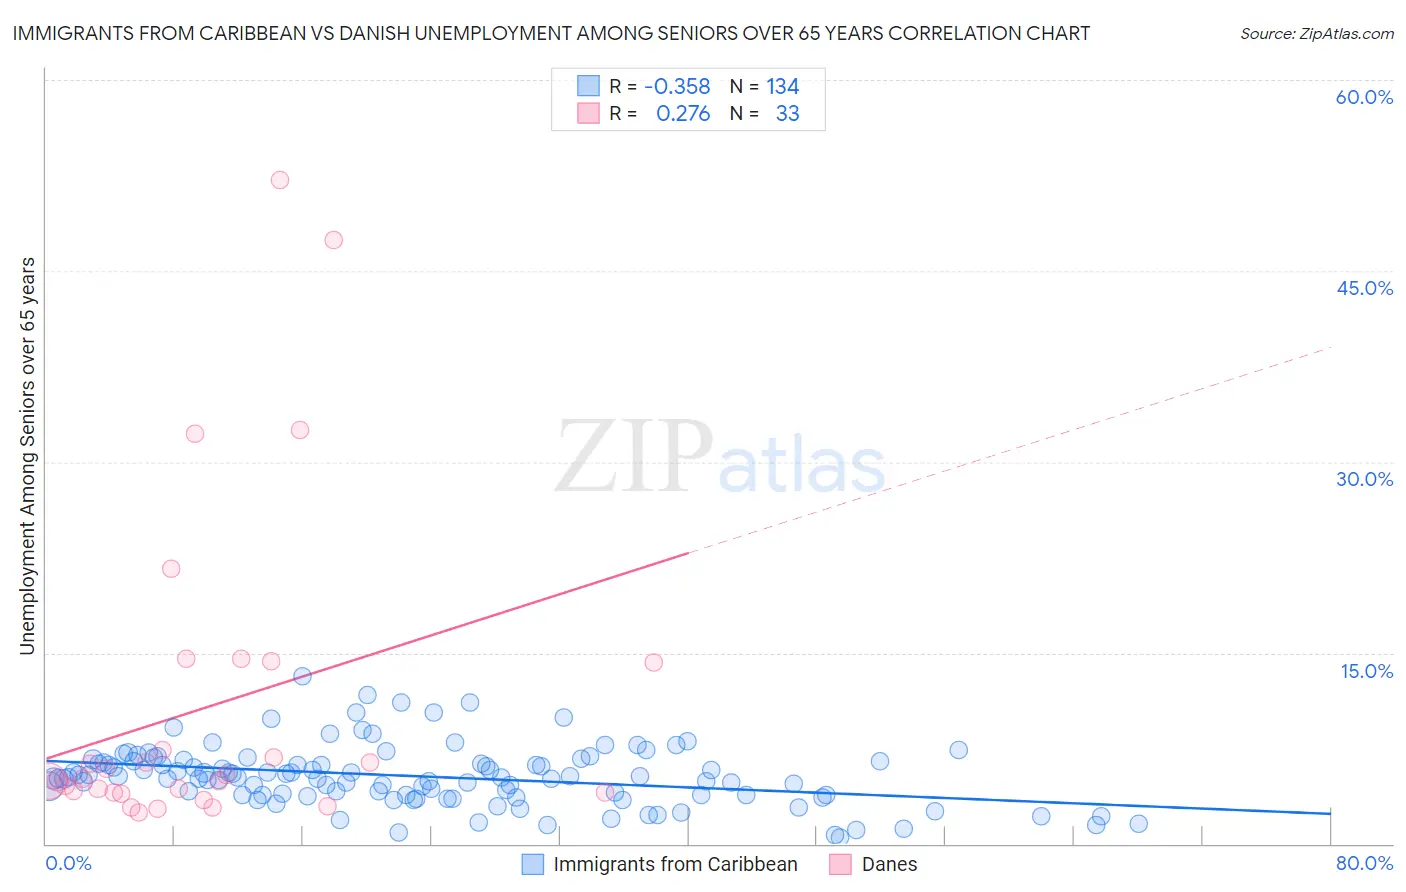
Immigrants from Caribbean vs Danish Unemployment Among Seniors over 65 years Correlation Chart
The statistical analysis conducted on geographies consisting of 398,914,633 people shows a mild negative correlation between the proportion of Immigrants from Caribbean and unemployment rate amomg seniors over the age of 65 in the United States with a correlation coefficient (R) of -0.358 and weighted average of 5.3%. Similarly, the statistical analysis conducted on geographies consisting of 406,256,619 people shows a weak positive correlation between the proportion of Danes and unemployment rate amomg seniors over the age of 65 in the United States with a correlation coefficient (R) of 0.276 and weighted average of 4.9%, a difference of 9.4%.
Unemployment Among Seniors over 65 years Correlation Summary
| Measurement | Immigrants from Caribbean | Danish |
| Minimum | 0.50% | 2.4% |
| Maximum | 13.2% | 52.1% |
| Range | 12.7% | 49.7% |
| Mean | 5.3% | 10.7% |
| Median | 5.2% | 5.2% |
| Interquartile 25% (IQ1) | 3.8% | 4.0% |
| Interquartile 75% (IQ3) | 6.5% | 14.3% |
| Interquartile Range (IQR) | 2.7% | 10.3% |
| Standard Deviation (Sample) | 2.3% | 12.6% |
| Standard Deviation (Population) | 2.3% | 12.4% |
Similar Demographics by Unemployment Among Seniors over 65 years
Demographics Similar to Immigrants from Caribbean by Unemployment Among Seniors over 65 years
In terms of unemployment among seniors over 65 years, the demographic groups most similar to Immigrants from Caribbean are Colombian (5.3%, a difference of 0.040%), French Canadian (5.4%, a difference of 0.050%), Ottawa (5.3%, a difference of 0.070%), Peruvian (5.3%, a difference of 0.080%), and Immigrants (5.4%, a difference of 0.080%).
| Demographics | Rating | Rank | Unemployment Among Seniors over 65 years |
| Immigrants | Trinidad and Tobago | 1.6 /100 | #240 | Tragic 5.3% |
| Apache | 1.3 /100 | #241 | Tragic 5.3% |
| Bahamians | 0.9 /100 | #242 | Tragic 5.3% |
| Nigerians | 0.9 /100 | #243 | Tragic 5.3% |
| Peruvians | 0.8 /100 | #244 | Tragic 5.3% |
| Ottawa | 0.8 /100 | #245 | Tragic 5.3% |
| Colombians | 0.7 /100 | #246 | Tragic 5.3% |
| Immigrants | Caribbean | 0.7 /100 | #247 | Tragic 5.3% |
| French Canadians | 0.7 /100 | #248 | Tragic 5.4% |
| Immigrants | Immigrants | 0.6 /100 | #249 | Tragic 5.4% |
| Ghanaians | 0.6 /100 | #250 | Tragic 5.4% |
| West Indians | 0.6 /100 | #251 | Tragic 5.4% |
| Trinidadians and Tobagonians | 0.6 /100 | #252 | Tragic 5.4% |
| Immigrants | Sierra Leone | 0.6 /100 | #253 | Tragic 5.4% |
| Paraguayans | 0.5 /100 | #254 | Tragic 5.4% |
Demographics Similar to Danes by Unemployment Among Seniors over 65 years
In terms of unemployment among seniors over 65 years, the demographic groups most similar to Danes are Scandinavian (4.9%, a difference of 0.010%), Carpatho Rusyn (4.9%, a difference of 0.050%), European (4.9%, a difference of 0.10%), Immigrants from Iraq (4.9%, a difference of 0.11%), and Immigrants from Sudan (4.9%, a difference of 0.17%).
| Demographics | Rating | Rank | Unemployment Among Seniors over 65 years |
| Immigrants | Austria | 99.9 /100 | #50 | Exceptional 4.9% |
| Scotch-Irish | 99.9 /100 | #51 | Exceptional 4.9% |
| Swedes | 99.9 /100 | #52 | Exceptional 4.9% |
| Immigrants | Sudan | 99.8 /100 | #53 | Exceptional 4.9% |
| Immigrants | Iraq | 99.8 /100 | #54 | Exceptional 4.9% |
| Europeans | 99.8 /100 | #55 | Exceptional 4.9% |
| Carpatho Rusyns | 99.8 /100 | #56 | Exceptional 4.9% |
| Danes | 99.8 /100 | #57 | Exceptional 4.9% |
| Scandinavians | 99.8 /100 | #58 | Exceptional 4.9% |
| Immigrants | Eastern Africa | 99.7 /100 | #59 | Exceptional 4.9% |
| Immigrants | Middle Africa | 99.7 /100 | #60 | Exceptional 4.9% |
| Northern Europeans | 99.7 /100 | #61 | Exceptional 4.9% |
| Latvians | 99.6 /100 | #62 | Exceptional 4.9% |
| Croatians | 99.6 /100 | #63 | Exceptional 4.9% |
| Immigrants | Cambodia | 99.6 /100 | #64 | Exceptional 4.9% |