Greek vs Danish Unemployment Among Seniors over 65 years
COMPARE
Greek
Danish
Unemployment Among Seniors over 65 years
Unemployment Among Seniors over 65 years Comparison
Greeks
Danes
5.1%
UNEMPLOYMENT AMONG SENIORS OVER 65 YEARS
77.0/ 100
METRIC RATING
148th/ 347
METRIC RANK
4.9%
UNEMPLOYMENT AMONG SENIORS OVER 65 YEARS
99.8/ 100
METRIC RATING
57th/ 347
METRIC RANK
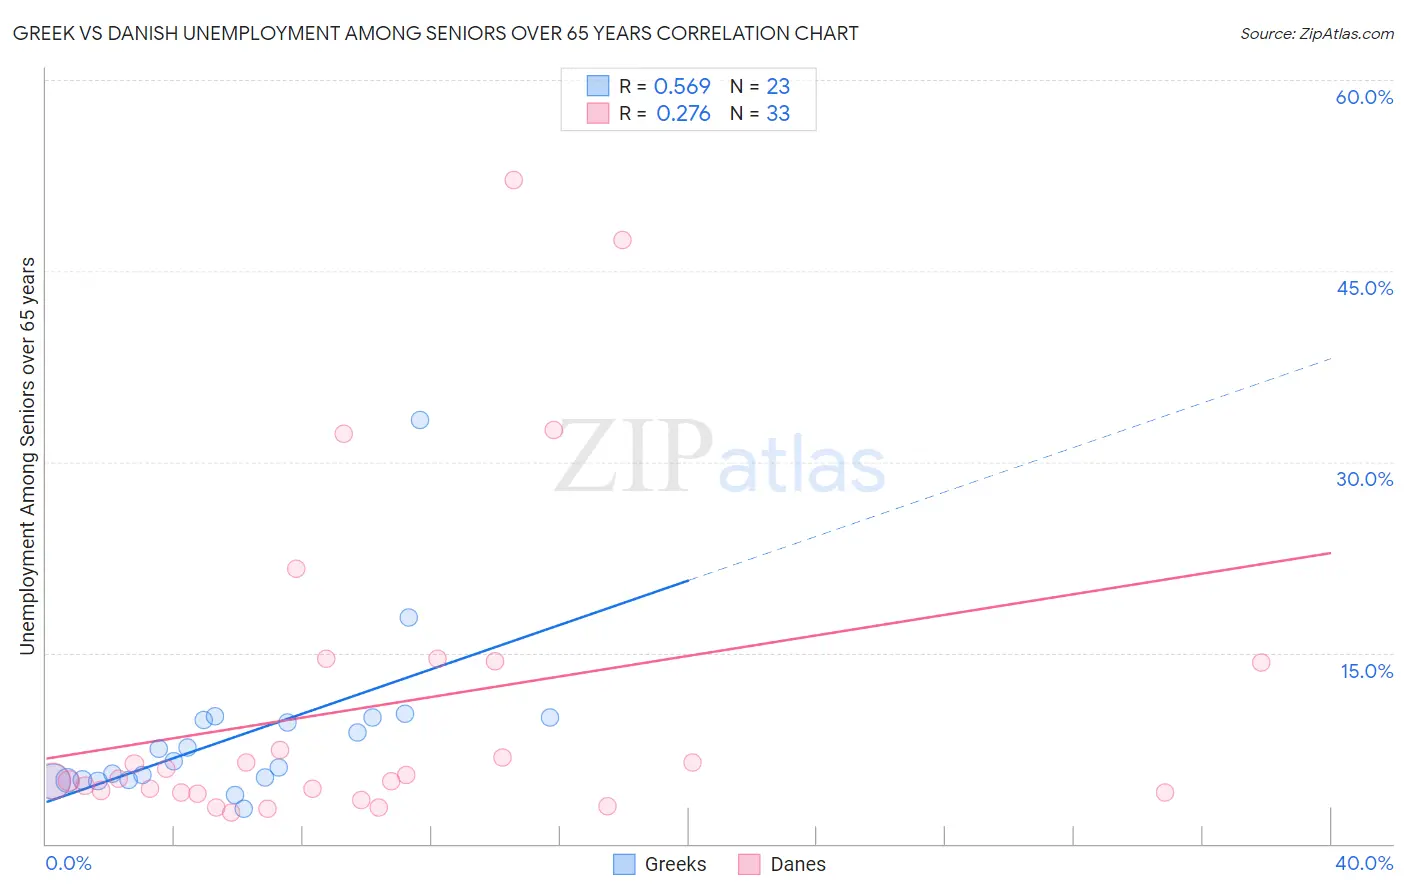
Greek vs Danish Unemployment Among Seniors over 65 years Correlation Chart
The statistical analysis conducted on geographies consisting of 418,448,484 people shows a substantial positive correlation between the proportion of Greeks and unemployment rate amomg seniors over the age of 65 in the United States with a correlation coefficient (R) of 0.569 and weighted average of 5.1%. Similarly, the statistical analysis conducted on geographies consisting of 406,256,619 people shows a weak positive correlation between the proportion of Danes and unemployment rate amomg seniors over the age of 65 in the United States with a correlation coefficient (R) of 0.276 and weighted average of 4.9%, a difference of 4.2%.
Unemployment Among Seniors over 65 years Correlation Summary
| Measurement | Greek | Danish |
| Minimum | 2.7% | 2.4% |
| Maximum | 33.3% | 52.1% |
| Range | 30.6% | 49.7% |
| Mean | 8.4% | 10.7% |
| Median | 6.5% | 5.2% |
| Interquartile 25% (IQ1) | 5.0% | 4.0% |
| Interquartile 75% (IQ3) | 9.9% | 14.3% |
| Interquartile Range (IQR) | 4.9% | 10.3% |
| Standard Deviation (Sample) | 6.3% | 12.6% |
| Standard Deviation (Population) | 6.2% | 12.4% |
Similar Demographics by Unemployment Among Seniors over 65 years
Demographics Similar to Greeks by Unemployment Among Seniors over 65 years
In terms of unemployment among seniors over 65 years, the demographic groups most similar to Greeks are Immigrants from Afghanistan (5.1%, a difference of 0.010%), Slovak (5.1%, a difference of 0.040%), Immigrants from Asia (5.1%, a difference of 0.060%), Immigrants from Russia (5.1%, a difference of 0.070%), and Pakistani (5.1%, a difference of 0.070%).
| Demographics | Rating | Rank | Unemployment Among Seniors over 65 years |
| Cherokee | 81.6 /100 | #141 | Excellent 5.1% |
| Immigrants | Indonesia | 81.0 /100 | #142 | Excellent 5.1% |
| Senegalese | 80.4 /100 | #143 | Excellent 5.1% |
| Poles | 80.3 /100 | #144 | Excellent 5.1% |
| Spanish | 78.8 /100 | #145 | Good 5.1% |
| Immigrants | Russia | 78.5 /100 | #146 | Good 5.1% |
| Slovaks | 77.9 /100 | #147 | Good 5.1% |
| Greeks | 77.0 /100 | #148 | Good 5.1% |
| Immigrants | Afghanistan | 76.8 /100 | #149 | Good 5.1% |
| Immigrants | Asia | 75.6 /100 | #150 | Good 5.1% |
| Pakistanis | 75.5 /100 | #151 | Good 5.1% |
| Canadians | 74.7 /100 | #152 | Good 5.1% |
| Immigrants | Czechoslovakia | 74.5 /100 | #153 | Good 5.1% |
| Immigrants | Hong Kong | 74.0 /100 | #154 | Good 5.1% |
| Basques | 72.9 /100 | #155 | Good 5.1% |
Demographics Similar to Danes by Unemployment Among Seniors over 65 years
In terms of unemployment among seniors over 65 years, the demographic groups most similar to Danes are Scandinavian (4.9%, a difference of 0.010%), Carpatho Rusyn (4.9%, a difference of 0.050%), European (4.9%, a difference of 0.10%), Immigrants from Iraq (4.9%, a difference of 0.11%), and Immigrants from Sudan (4.9%, a difference of 0.17%).
| Demographics | Rating | Rank | Unemployment Among Seniors over 65 years |
| Immigrants | Austria | 99.9 /100 | #50 | Exceptional 4.9% |
| Scotch-Irish | 99.9 /100 | #51 | Exceptional 4.9% |
| Swedes | 99.9 /100 | #52 | Exceptional 4.9% |
| Immigrants | Sudan | 99.8 /100 | #53 | Exceptional 4.9% |
| Immigrants | Iraq | 99.8 /100 | #54 | Exceptional 4.9% |
| Europeans | 99.8 /100 | #55 | Exceptional 4.9% |
| Carpatho Rusyns | 99.8 /100 | #56 | Exceptional 4.9% |
| Danes | 99.8 /100 | #57 | Exceptional 4.9% |
| Scandinavians | 99.8 /100 | #58 | Exceptional 4.9% |
| Immigrants | Eastern Africa | 99.7 /100 | #59 | Exceptional 4.9% |
| Immigrants | Middle Africa | 99.7 /100 | #60 | Exceptional 4.9% |
| Northern Europeans | 99.7 /100 | #61 | Exceptional 4.9% |
| Latvians | 99.6 /100 | #62 | Exceptional 4.9% |
| Croatians | 99.6 /100 | #63 | Exceptional 4.9% |
| Immigrants | Cambodia | 99.6 /100 | #64 | Exceptional 4.9% |