Immigrants from Cabo Verde vs Belgian Unemployment Among Ages 60 to 64 years
COMPARE
Immigrants from Cabo Verde
Belgian
Unemployment Among Ages 60 to 64 years
Unemployment Among Ages 60 to 64 years Comparison
Immigrants from Cabo Verde
Belgians
4.4%
UNEMPLOYMENT AMONG AGES 60 TO 64 YEARS
100.0/ 100
METRIC RATING
21st/ 347
METRIC RANK
4.5%
UNEMPLOYMENT AMONG AGES 60 TO 64 YEARS
100.0/ 100
METRIC RATING
34th/ 347
METRIC RANK
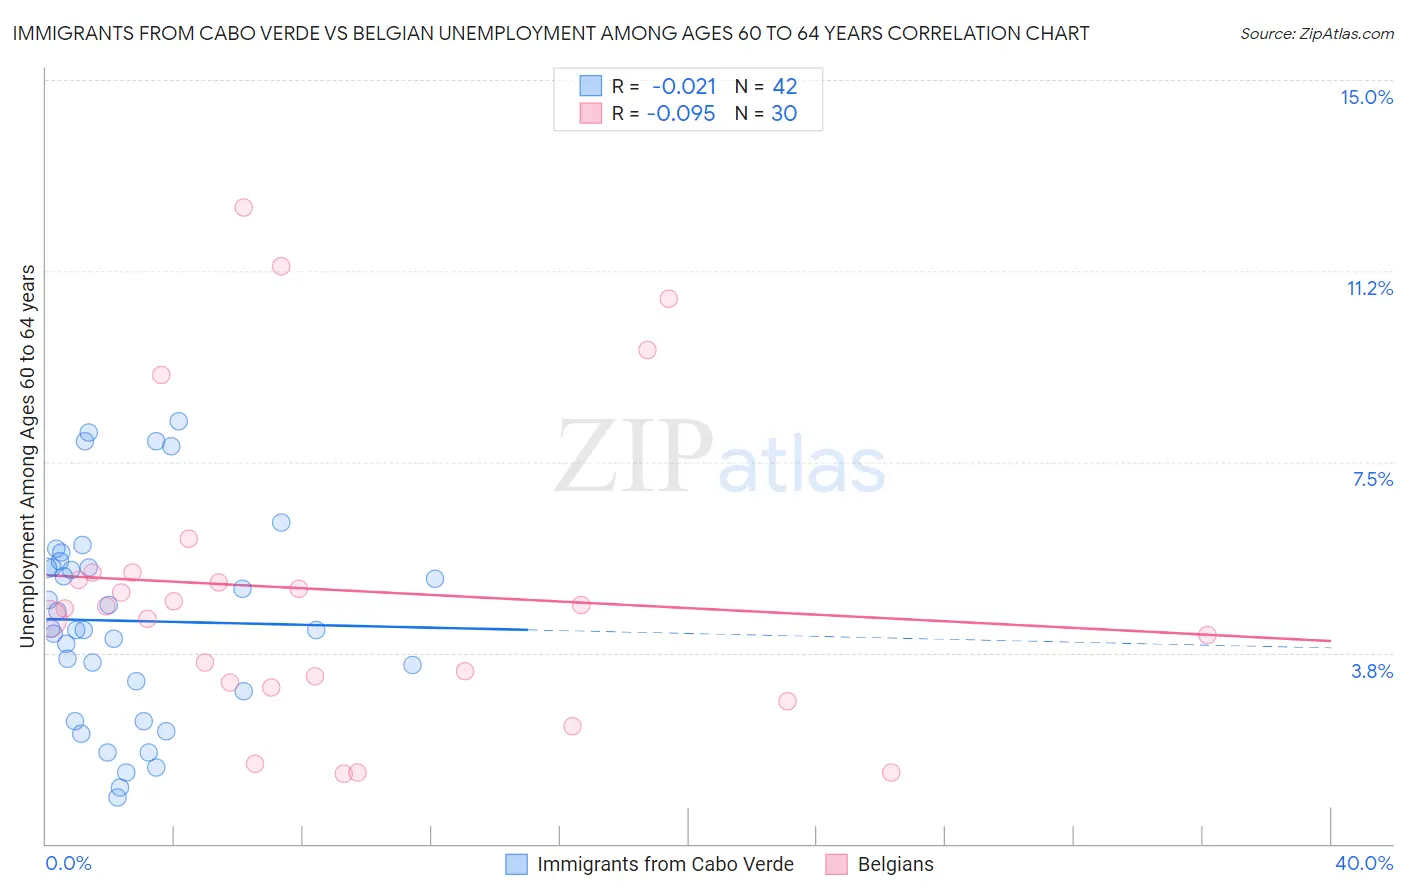
Immigrants from Cabo Verde vs Belgian Unemployment Among Ages 60 to 64 years Correlation Chart
The statistical analysis conducted on geographies consisting of 37,190,572 people shows no correlation between the proportion of Immigrants from Cabo Verde and unemployment rate among population between the ages 60 and 64 in the United States with a correlation coefficient (R) of -0.021 and weighted average of 4.4%. Similarly, the statistical analysis conducted on geographies consisting of 318,582,400 people shows a slight negative correlation between the proportion of Belgians and unemployment rate among population between the ages 60 and 64 in the United States with a correlation coefficient (R) of -0.095 and weighted average of 4.5%, a difference of 2.1%.
Unemployment Among Ages 60 to 64 years Correlation Summary
| Measurement | Immigrants from Cabo Verde | Belgian |
| Minimum | 0.90% | 1.4% |
| Maximum | 8.3% | 12.5% |
| Range | 7.4% | 11.1% |
| Mean | 4.4% | 5.0% |
| Median | 4.2% | 4.6% |
| Interquartile 25% (IQ1) | 3.0% | 3.2% |
| Interquartile 75% (IQ3) | 5.4% | 5.3% |
| Interquartile Range (IQR) | 2.4% | 2.1% |
| Standard Deviation (Sample) | 2.0% | 2.9% |
| Standard Deviation (Population) | 2.0% | 2.9% |
Demographics Similar to Immigrants from Cabo Verde and Belgians by Unemployment Among Ages 60 to 64 years
In terms of unemployment among ages 60 to 64 years, the demographic groups most similar to Immigrants from Cabo Verde are Afghan (4.4%, a difference of 0.0%), Cape Verdean (4.4%, a difference of 0.080%), Tsimshian (4.4%, a difference of 0.15%), Slovene (4.4%, a difference of 0.25%), and Immigrants from Zaire (4.4%, a difference of 0.28%). Similarly, the demographic groups most similar to Belgians are German (4.5%, a difference of 0.020%), Venezuelan (4.5%, a difference of 0.030%), Immigrants from Portugal (4.5%, a difference of 0.060%), Carpatho Rusyn (4.5%, a difference of 0.26%), and Zimbabwean (4.5%, a difference of 0.31%).
| Demographics | Rating | Rank | Unemployment Among Ages 60 to 64 years |
| Immigrants | Afghanistan | 100.0 /100 | #17 | Exceptional 4.4% |
| Slovenes | 100.0 /100 | #18 | Exceptional 4.4% |
| Tsimshian | 100.0 /100 | #19 | Exceptional 4.4% |
| Afghans | 100.0 /100 | #20 | Exceptional 4.4% |
| Immigrants | Cabo Verde | 100.0 /100 | #21 | Exceptional 4.4% |
| Cape Verdeans | 100.0 /100 | #22 | Exceptional 4.4% |
| Immigrants | Zaire | 100.0 /100 | #23 | Exceptional 4.4% |
| Immigrants | Burma/Myanmar | 100.0 /100 | #24 | Exceptional 4.4% |
| Yugoslavians | 100.0 /100 | #25 | Exceptional 4.4% |
| Czechs | 100.0 /100 | #26 | Exceptional 4.4% |
| Immigrants | Iraq | 100.0 /100 | #27 | Exceptional 4.5% |
| Immigrants | Nepal | 100.0 /100 | #28 | Exceptional 4.5% |
| Cubans | 100.0 /100 | #29 | Exceptional 4.5% |
| Immigrants | Venezuela | 100.0 /100 | #30 | Exceptional 4.5% |
| Immigrants | Eritrea | 100.0 /100 | #31 | Exceptional 4.5% |
| Zimbabweans | 100.0 /100 | #32 | Exceptional 4.5% |
| Carpatho Rusyns | 100.0 /100 | #33 | Exceptional 4.5% |
| Belgians | 100.0 /100 | #34 | Exceptional 4.5% |
| Germans | 100.0 /100 | #35 | Exceptional 4.5% |
| Venezuelans | 100.0 /100 | #36 | Exceptional 4.5% |
| Immigrants | Portugal | 100.0 /100 | #37 | Exceptional 4.5% |