Immigrants from Bulgaria vs Immigrants from Chile Unemployment Among Women with Children Under 18 years
COMPARE
Immigrants from Bulgaria
Immigrants from Chile
Unemployment Among Women with Children Under 18 years
Unemployment Among Women with Children Under 18 years Comparison
Immigrants from Bulgaria
Immigrants from Chile
5.1%
UNEMPLOYMENT AMONG WOMEN WITH CHILDREN UNDER 18 YEARS
97.4/ 100
METRIC RATING
62nd/ 347
METRIC RANK
5.5%
UNEMPLOYMENT AMONG WOMEN WITH CHILDREN UNDER 18 YEARS
29.2/ 100
METRIC RATING
194th/ 347
METRIC RANK
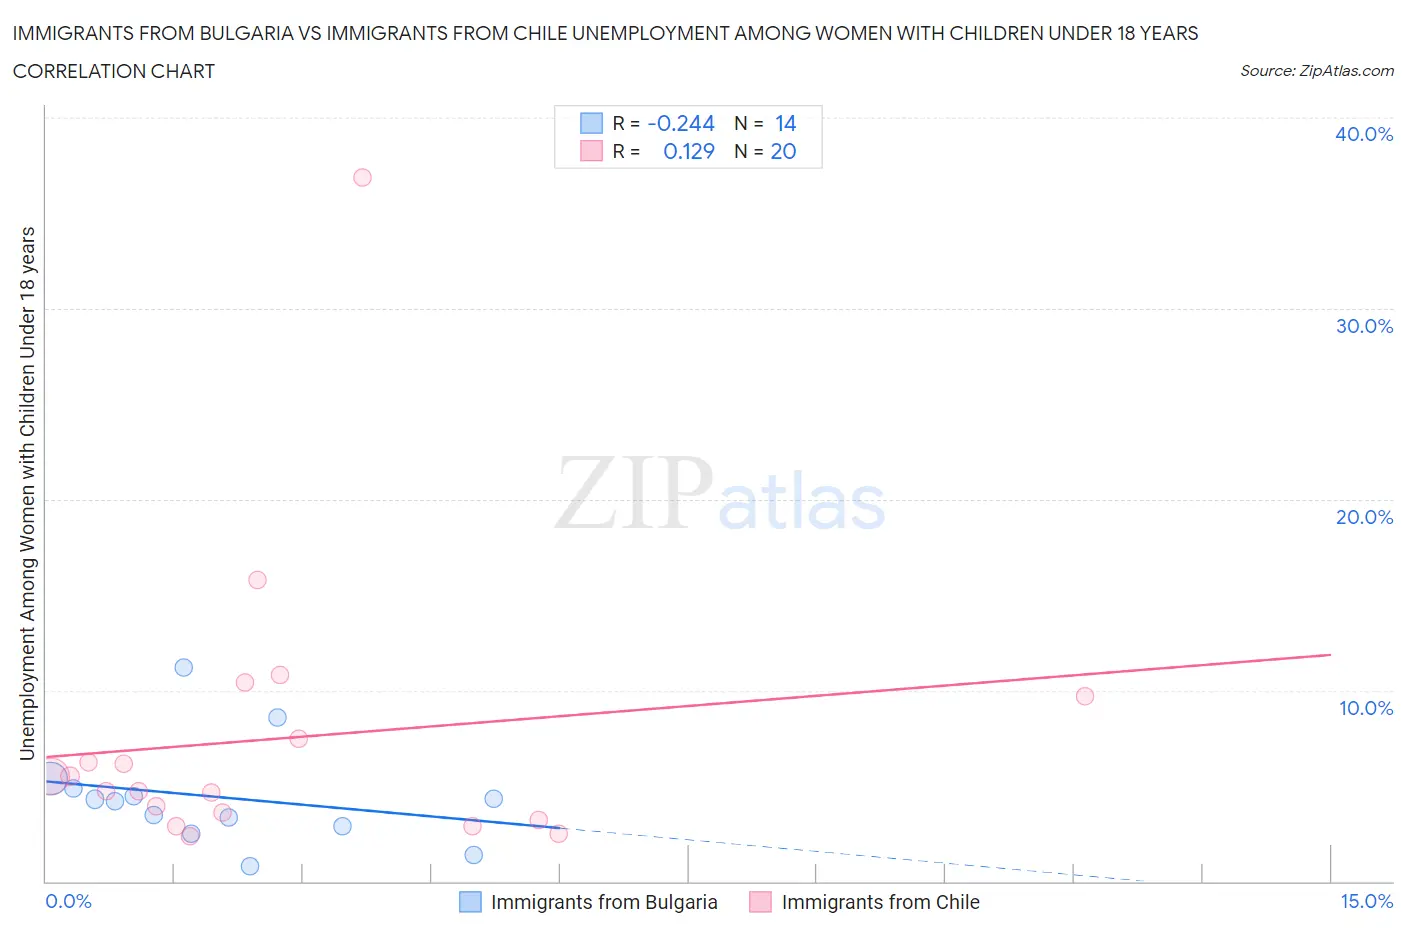
Immigrants from Bulgaria vs Immigrants from Chile Unemployment Among Women with Children Under 18 years Correlation Chart
The statistical analysis conducted on geographies consisting of 169,651,833 people shows a weak negative correlation between the proportion of Immigrants from Bulgaria and unemployment rate among women with children under the age of 18 in the United States with a correlation coefficient (R) of -0.244 and weighted average of 5.1%. Similarly, the statistical analysis conducted on geographies consisting of 214,872,521 people shows a poor positive correlation between the proportion of Immigrants from Chile and unemployment rate among women with children under the age of 18 in the United States with a correlation coefficient (R) of 0.129 and weighted average of 5.5%, a difference of 8.6%.
Unemployment Among Women with Children Under 18 years Correlation Summary
| Measurement | Immigrants from Bulgaria | Immigrants from Chile |
| Minimum | 0.80% | 2.4% |
| Maximum | 11.2% | 36.9% |
| Range | 10.4% | 34.5% |
| Mean | 4.4% | 7.5% |
| Median | 4.2% | 5.1% |
| Interquartile 25% (IQ1) | 2.9% | 3.4% |
| Interquartile 75% (IQ3) | 4.8% | 8.6% |
| Interquartile Range (IQR) | 1.9% | 5.2% |
| Standard Deviation (Sample) | 2.7% | 7.7% |
| Standard Deviation (Population) | 2.6% | 7.5% |
Similar Demographics by Unemployment Among Women with Children Under 18 years
Demographics Similar to Immigrants from Bulgaria by Unemployment Among Women with Children Under 18 years
In terms of unemployment among women with children under 18 years, the demographic groups most similar to Immigrants from Bulgaria are Italian (5.1%, a difference of 0.010%), Russian (5.1%, a difference of 0.070%), Estonian (5.1%, a difference of 0.19%), Immigrants from Sweden (5.1%, a difference of 0.21%), and Welsh (5.1%, a difference of 0.22%).
| Demographics | Rating | Rank | Unemployment Among Women with Children Under 18 years |
| Immigrants | Sri Lanka | 98.1 /100 | #55 | Exceptional 5.1% |
| Immigrants | Ireland | 98.0 /100 | #56 | Exceptional 5.1% |
| Czechoslovakians | 98.0 /100 | #57 | Exceptional 5.1% |
| Immigrants | Belgium | 97.9 /100 | #58 | Exceptional 5.1% |
| Asians | 97.9 /100 | #59 | Exceptional 5.1% |
| Welsh | 97.7 /100 | #60 | Exceptional 5.1% |
| Russians | 97.5 /100 | #61 | Exceptional 5.1% |
| Immigrants | Bulgaria | 97.4 /100 | #62 | Exceptional 5.1% |
| Italians | 97.4 /100 | #63 | Exceptional 5.1% |
| Estonians | 97.2 /100 | #64 | Exceptional 5.1% |
| Immigrants | Sweden | 97.1 /100 | #65 | Exceptional 5.1% |
| Immigrants | Australia | 97.0 /100 | #66 | Exceptional 5.1% |
| Fijians | 96.9 /100 | #67 | Exceptional 5.1% |
| Irish | 96.8 /100 | #68 | Exceptional 5.1% |
| Austrians | 96.6 /100 | #69 | Exceptional 5.1% |
Demographics Similar to Immigrants from Chile by Unemployment Among Women with Children Under 18 years
In terms of unemployment among women with children under 18 years, the demographic groups most similar to Immigrants from Chile are Immigrants from Afghanistan (5.5%, a difference of 0.010%), Immigrants from Spain (5.5%, a difference of 0.13%), South American Indian (5.5%, a difference of 0.14%), Immigrants from Poland (5.5%, a difference of 0.17%), and Immigrants from Eritrea (5.5%, a difference of 0.38%).
| Demographics | Rating | Rank | Unemployment Among Women with Children Under 18 years |
| Malaysians | 35.7 /100 | #187 | Fair 5.5% |
| Iraqis | 35.3 /100 | #188 | Fair 5.5% |
| Immigrants | Eritrea | 33.8 /100 | #189 | Fair 5.5% |
| Immigrants | Poland | 31.2 /100 | #190 | Fair 5.5% |
| South American Indians | 30.8 /100 | #191 | Fair 5.5% |
| Immigrants | Spain | 30.7 /100 | #192 | Fair 5.5% |
| Immigrants | Afghanistan | 29.3 /100 | #193 | Fair 5.5% |
| Immigrants | Chile | 29.2 /100 | #194 | Fair 5.5% |
| Colombians | 22.8 /100 | #195 | Fair 5.6% |
| Spaniards | 22.8 /100 | #196 | Fair 5.6% |
| Immigrants | Colombia | 21.4 /100 | #197 | Fair 5.6% |
| Arabs | 21.4 /100 | #198 | Fair 5.6% |
| Marshallese | 20.2 /100 | #199 | Fair 5.6% |
| Menominee | 18.6 /100 | #200 | Poor 5.6% |
| Immigrants | Morocco | 17.9 /100 | #201 | Poor 5.6% |