Central American vs Immigrants from Chile Unemployment Among Women with Children Under 18 years
COMPARE
Central American
Immigrants from Chile
Unemployment Among Women with Children Under 18 years
Unemployment Among Women with Children Under 18 years Comparison
Central Americans
Immigrants from Chile
6.2%
UNEMPLOYMENT AMONG WOMEN WITH CHILDREN UNDER 18 YEARS
0.0/ 100
METRIC RATING
271st/ 347
METRIC RANK
5.5%
UNEMPLOYMENT AMONG WOMEN WITH CHILDREN UNDER 18 YEARS
29.2/ 100
METRIC RATING
194th/ 347
METRIC RANK
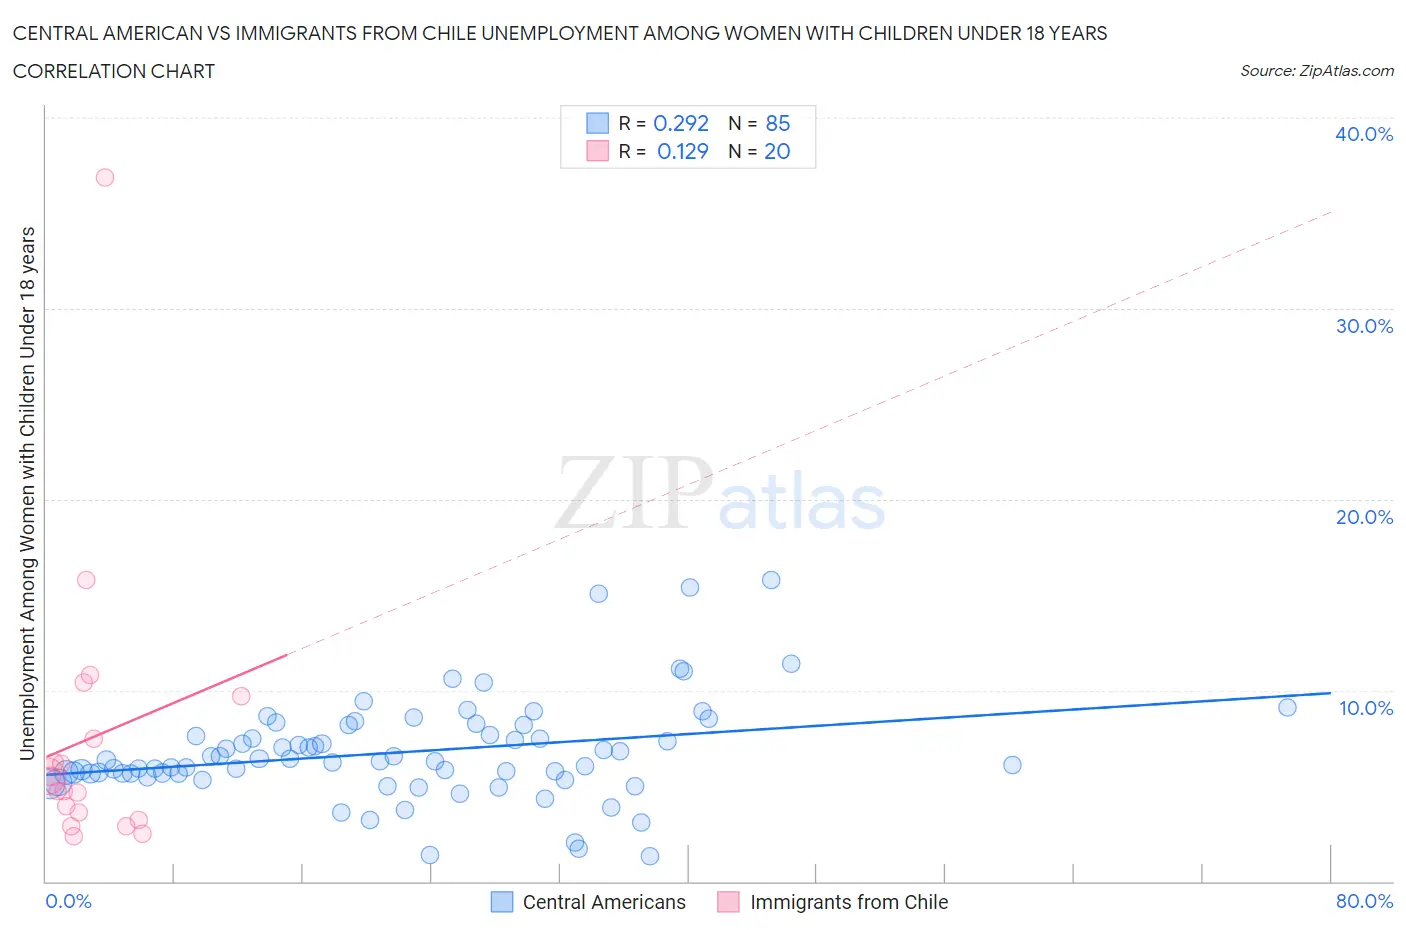
Central American vs Immigrants from Chile Unemployment Among Women with Children Under 18 years Correlation Chart
The statistical analysis conducted on geographies consisting of 475,723,828 people shows a weak positive correlation between the proportion of Central Americans and unemployment rate among women with children under the age of 18 in the United States with a correlation coefficient (R) of 0.292 and weighted average of 6.2%. Similarly, the statistical analysis conducted on geographies consisting of 214,872,521 people shows a poor positive correlation between the proportion of Immigrants from Chile and unemployment rate among women with children under the age of 18 in the United States with a correlation coefficient (R) of 0.129 and weighted average of 5.5%, a difference of 11.9%.
Unemployment Among Women with Children Under 18 years Correlation Summary
| Measurement | Central American | Immigrants from Chile |
| Minimum | 1.3% | 2.4% |
| Maximum | 15.8% | 36.9% |
| Range | 14.5% | 34.5% |
| Mean | 6.8% | 7.5% |
| Median | 6.3% | 5.1% |
| Interquartile 25% (IQ1) | 5.6% | 3.4% |
| Interquartile 75% (IQ3) | 7.9% | 8.6% |
| Interquartile Range (IQR) | 2.3% | 5.2% |
| Standard Deviation (Sample) | 2.6% | 7.7% |
| Standard Deviation (Population) | 2.6% | 7.5% |
Similar Demographics by Unemployment Among Women with Children Under 18 years
Demographics Similar to Central Americans by Unemployment Among Women with Children Under 18 years
In terms of unemployment among women with children under 18 years, the demographic groups most similar to Central Americans are Salvadoran (6.2%, a difference of 0.22%), Cajun (6.2%, a difference of 0.30%), Ghanaian (6.2%, a difference of 0.30%), Immigrants from Western Africa (6.2%, a difference of 0.31%), and Senegalese (6.2%, a difference of 0.33%).
| Demographics | Rating | Rank | Unemployment Among Women with Children Under 18 years |
| Comanche | 0.1 /100 | #264 | Tragic 6.1% |
| Immigrants | Bahamas | 0.1 /100 | #265 | Tragic 6.1% |
| Sub-Saharan Africans | 0.1 /100 | #266 | Tragic 6.2% |
| French American Indians | 0.1 /100 | #267 | Tragic 6.2% |
| Trinidadians and Tobagonians | 0.1 /100 | #268 | Tragic 6.2% |
| Cajuns | 0.1 /100 | #269 | Tragic 6.2% |
| Ghanaians | 0.1 /100 | #270 | Tragic 6.2% |
| Central Americans | 0.0 /100 | #271 | Tragic 6.2% |
| Salvadorans | 0.0 /100 | #272 | Tragic 6.2% |
| Immigrants | Western Africa | 0.0 /100 | #273 | Tragic 6.2% |
| Senegalese | 0.0 /100 | #274 | Tragic 6.2% |
| Dutch West Indians | 0.0 /100 | #275 | Tragic 6.2% |
| Immigrants | Ghana | 0.0 /100 | #276 | Tragic 6.2% |
| Mexican American Indians | 0.0 /100 | #277 | Tragic 6.2% |
| Immigrants | Barbados | 0.0 /100 | #278 | Tragic 6.2% |
Demographics Similar to Immigrants from Chile by Unemployment Among Women with Children Under 18 years
In terms of unemployment among women with children under 18 years, the demographic groups most similar to Immigrants from Chile are Immigrants from Afghanistan (5.5%, a difference of 0.010%), Immigrants from Spain (5.5%, a difference of 0.13%), South American Indian (5.5%, a difference of 0.14%), Immigrants from Poland (5.5%, a difference of 0.17%), and Immigrants from Eritrea (5.5%, a difference of 0.38%).
| Demographics | Rating | Rank | Unemployment Among Women with Children Under 18 years |
| Malaysians | 35.7 /100 | #187 | Fair 5.5% |
| Iraqis | 35.3 /100 | #188 | Fair 5.5% |
| Immigrants | Eritrea | 33.8 /100 | #189 | Fair 5.5% |
| Immigrants | Poland | 31.2 /100 | #190 | Fair 5.5% |
| South American Indians | 30.8 /100 | #191 | Fair 5.5% |
| Immigrants | Spain | 30.7 /100 | #192 | Fair 5.5% |
| Immigrants | Afghanistan | 29.3 /100 | #193 | Fair 5.5% |
| Immigrants | Chile | 29.2 /100 | #194 | Fair 5.5% |
| Colombians | 22.8 /100 | #195 | Fair 5.6% |
| Spaniards | 22.8 /100 | #196 | Fair 5.6% |
| Immigrants | Colombia | 21.4 /100 | #197 | Fair 5.6% |
| Arabs | 21.4 /100 | #198 | Fair 5.6% |
| Marshallese | 20.2 /100 | #199 | Fair 5.6% |
| Menominee | 18.6 /100 | #200 | Poor 5.6% |
| Immigrants | Morocco | 17.9 /100 | #201 | Poor 5.6% |