Immigrants from Belarus vs Russian Unemployment Among Ages 55 to 59 years
COMPARE
Immigrants from Belarus
Russian
Unemployment Among Ages 55 to 59 years
Unemployment Among Ages 55 to 59 years Comparison
Immigrants from Belarus
Russians
4.9%
UNEMPLOYMENT AMONG AGES 55 TO 59 YEARS
14.1/ 100
METRIC RATING
206th/ 347
METRIC RANK
4.9%
UNEMPLOYMENT AMONG AGES 55 TO 59 YEARS
33.9/ 100
METRIC RATING
190th/ 347
METRIC RANK
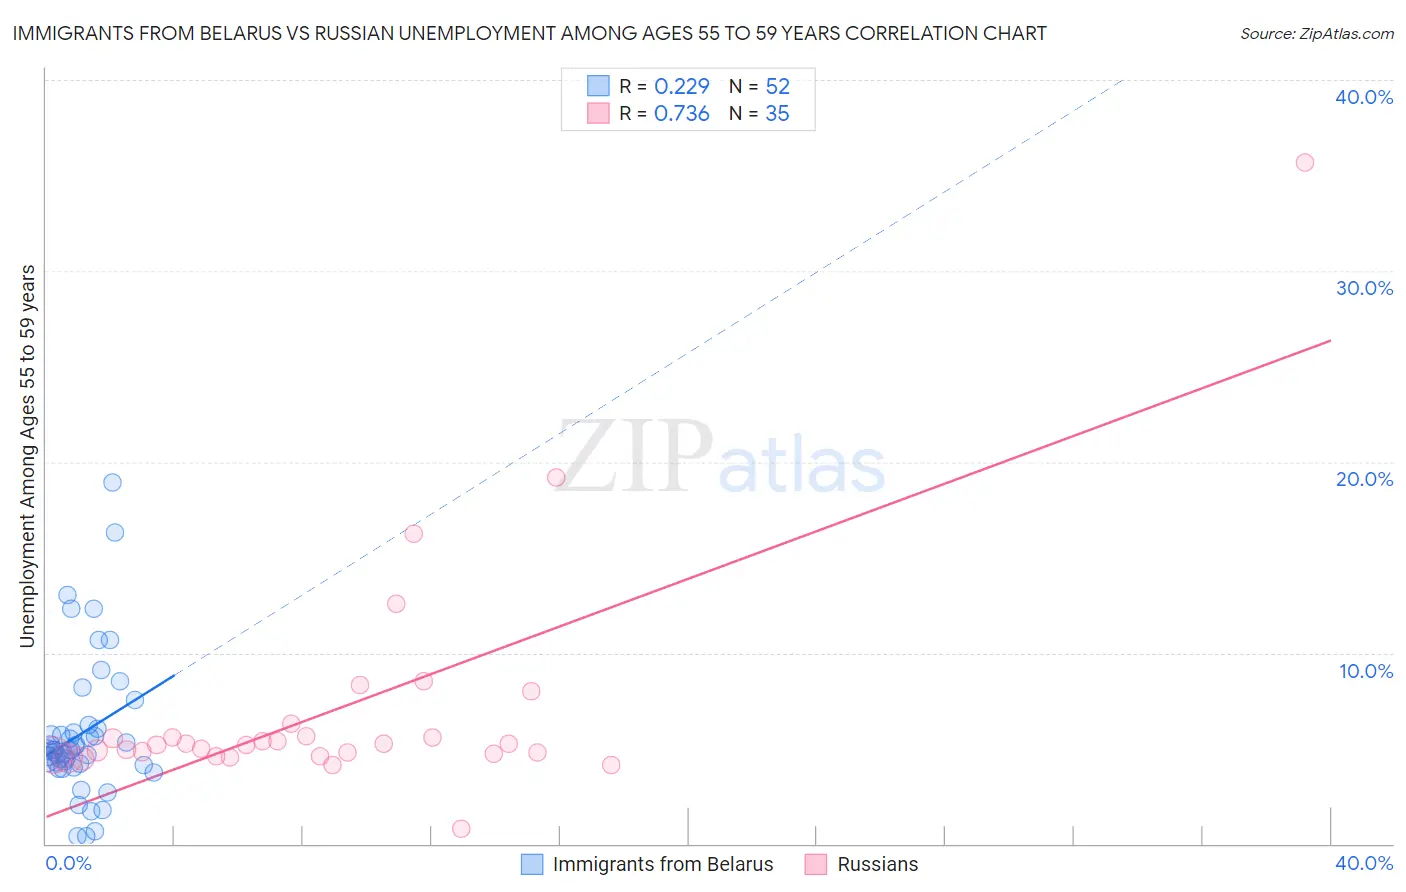
Immigrants from Belarus vs Russian Unemployment Among Ages 55 to 59 years Correlation Chart
The statistical analysis conducted on geographies consisting of 146,548,601 people shows a weak positive correlation between the proportion of Immigrants from Belarus and unemployment rate among population between the ages 55 and 59 in the United States with a correlation coefficient (R) of 0.229 and weighted average of 4.9%. Similarly, the statistical analysis conducted on geographies consisting of 454,565,892 people shows a strong positive correlation between the proportion of Russians and unemployment rate among population between the ages 55 and 59 in the United States with a correlation coefficient (R) of 0.736 and weighted average of 4.9%, a difference of 1.1%.
Unemployment Among Ages 55 to 59 years Correlation Summary
| Measurement | Immigrants from Belarus | Russian |
| Minimum | 0.40% | 0.80% |
| Maximum | 18.9% | 35.7% |
| Range | 18.5% | 34.9% |
| Mean | 5.8% | 7.0% |
| Median | 4.9% | 5.2% |
| Interquartile 25% (IQ1) | 4.1% | 4.7% |
| Interquartile 75% (IQ3) | 5.9% | 5.6% |
| Interquartile Range (IQR) | 1.8% | 0.95% |
| Standard Deviation (Sample) | 3.7% | 6.1% |
| Standard Deviation (Population) | 3.6% | 6.0% |
Demographics Similar to Immigrants from Belarus and Russians by Unemployment Among Ages 55 to 59 years
In terms of unemployment among ages 55 to 59 years, the demographic groups most similar to Immigrants from Belarus are Immigrants from Australia (4.9%, a difference of 0.0%), Immigrants from Kazakhstan (4.9%, a difference of 0.010%), Haitian (4.9%, a difference of 0.30%), Immigrants from Latvia (4.9%, a difference of 0.32%), and Guamanian/Chamorro (4.9%, a difference of 0.47%). Similarly, the demographic groups most similar to Russians are Iroquois (4.9%, a difference of 0.030%), Iranian (4.9%, a difference of 0.070%), Immigrants from Eastern Asia (4.8%, a difference of 0.10%), Immigrants from Ukraine (4.9%, a difference of 0.10%), and Immigrants from Italy (4.9%, a difference of 0.18%).
| Demographics | Rating | Rank | Unemployment Among Ages 55 to 59 years |
| Immigrants | Eastern Asia | 36.1 /100 | #188 | Fair 4.8% |
| Iroquois | 34.5 /100 | #189 | Fair 4.9% |
| Russians | 33.9 /100 | #190 | Fair 4.9% |
| Iranians | 32.4 /100 | #191 | Fair 4.9% |
| Immigrants | Ukraine | 31.7 /100 | #192 | Fair 4.9% |
| Immigrants | Italy | 30.1 /100 | #193 | Fair 4.9% |
| Spaniards | 27.2 /100 | #194 | Fair 4.9% |
| Estonians | 27.2 /100 | #195 | Fair 4.9% |
| Eastern Europeans | 26.7 /100 | #196 | Fair 4.9% |
| Macedonians | 26.4 /100 | #197 | Fair 4.9% |
| Immigrants | Philippines | 26.1 /100 | #198 | Fair 4.9% |
| Immigrants | Russia | 23.7 /100 | #199 | Fair 4.9% |
| Basques | 23.3 /100 | #200 | Fair 4.9% |
| Immigrants | South America | 23.1 /100 | #201 | Fair 4.9% |
| Lumbee | 22.5 /100 | #202 | Fair 4.9% |
| Guamanians/Chamorros | 20.8 /100 | #203 | Fair 4.9% |
| Immigrants | Latvia | 18.5 /100 | #204 | Poor 4.9% |
| Haitians | 18.1 /100 | #205 | Poor 4.9% |
| Immigrants | Belarus | 14.1 /100 | #206 | Poor 4.9% |
| Immigrants | Australia | 14.1 /100 | #207 | Poor 4.9% |
| Immigrants | Kazakhstan | 14.0 /100 | #208 | Poor 4.9% |