Immigrants from Belarus vs Immigrants from Kenya Unemployment Among Ages 55 to 59 years
COMPARE
Immigrants from Belarus
Immigrants from Kenya
Unemployment Among Ages 55 to 59 years
Unemployment Among Ages 55 to 59 years Comparison
Immigrants from Belarus
Immigrants from Kenya
4.9%
UNEMPLOYMENT AMONG AGES 55 TO 59 YEARS
14.1/ 100
METRIC RATING
206th/ 347
METRIC RANK
4.5%
UNEMPLOYMENT AMONG AGES 55 TO 59 YEARS
99.9/ 100
METRIC RATING
30th/ 347
METRIC RANK
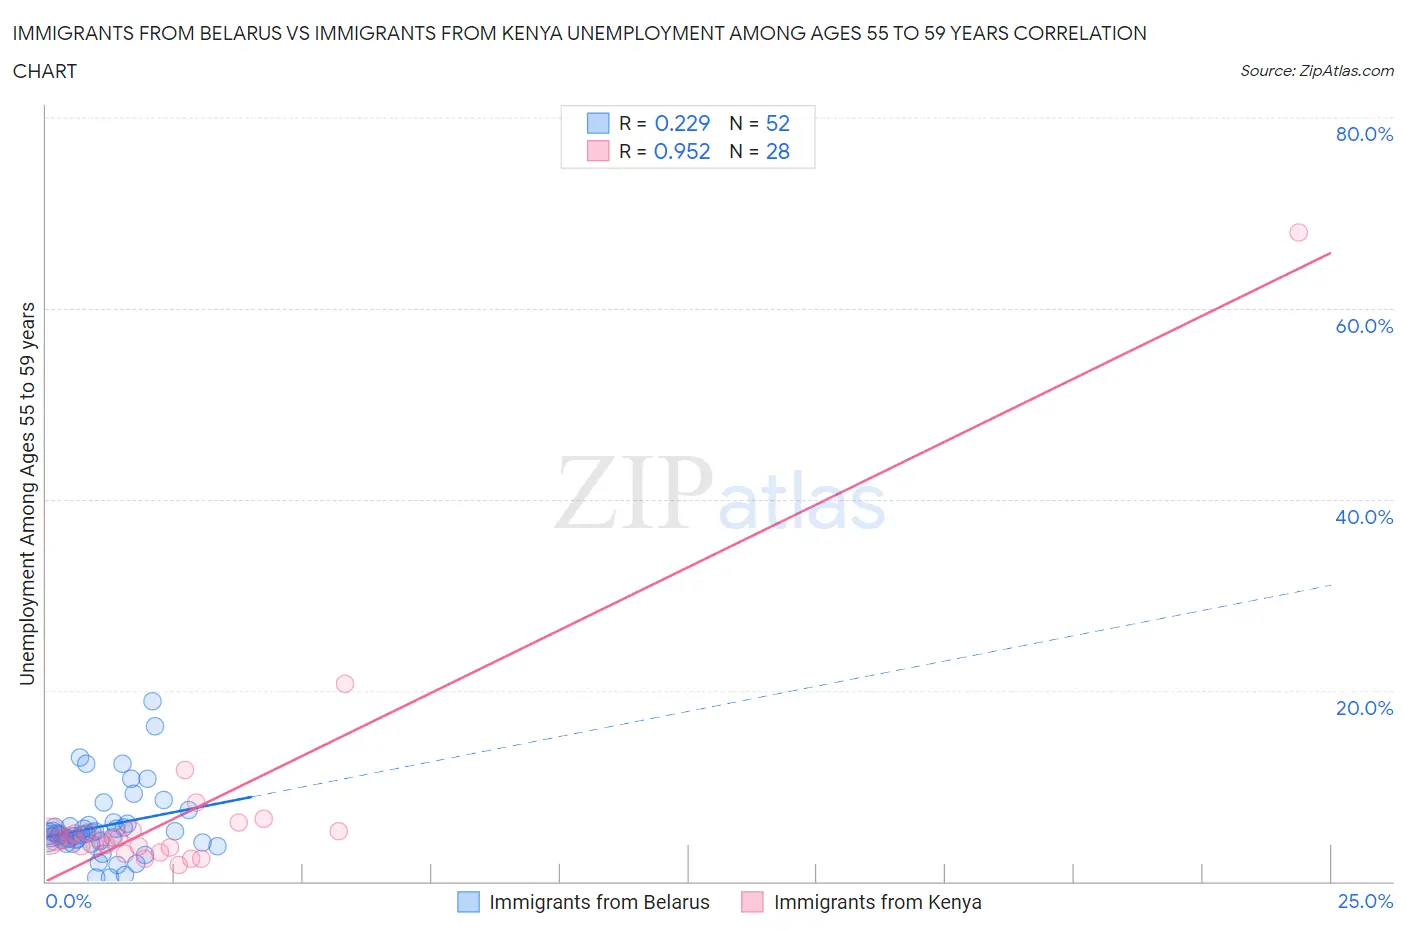
Immigrants from Belarus vs Immigrants from Kenya Unemployment Among Ages 55 to 59 years Correlation Chart
The statistical analysis conducted on geographies consisting of 146,548,601 people shows a weak positive correlation between the proportion of Immigrants from Belarus and unemployment rate among population between the ages 55 and 59 in the United States with a correlation coefficient (R) of 0.229 and weighted average of 4.9%. Similarly, the statistical analysis conducted on geographies consisting of 210,703,413 people shows a perfect positive correlation between the proportion of Immigrants from Kenya and unemployment rate among population between the ages 55 and 59 in the United States with a correlation coefficient (R) of 0.952 and weighted average of 4.5%, a difference of 10.1%.
Unemployment Among Ages 55 to 59 years Correlation Summary
| Measurement | Immigrants from Belarus | Immigrants from Kenya |
| Minimum | 0.40% | 1.7% |
| Maximum | 18.9% | 68.0% |
| Range | 18.5% | 66.3% |
| Mean | 5.8% | 7.4% |
| Median | 4.9% | 4.4% |
| Interquartile 25% (IQ1) | 4.1% | 3.6% |
| Interquartile 75% (IQ3) | 5.9% | 5.3% |
| Interquartile Range (IQR) | 1.8% | 1.8% |
| Standard Deviation (Sample) | 3.7% | 12.4% |
| Standard Deviation (Population) | 3.6% | 12.2% |
Similar Demographics by Unemployment Among Ages 55 to 59 years
Demographics Similar to Immigrants from Belarus by Unemployment Among Ages 55 to 59 years
In terms of unemployment among ages 55 to 59 years, the demographic groups most similar to Immigrants from Belarus are Immigrants from Australia (4.9%, a difference of 0.0%), Immigrants from Kazakhstan (4.9%, a difference of 0.010%), Immigrants from Haiti (4.9%, a difference of 0.070%), Creek (4.9%, a difference of 0.10%), and Hawaiian (4.9%, a difference of 0.11%).
| Demographics | Rating | Rank | Unemployment Among Ages 55 to 59 years |
| Immigrants | Russia | 23.7 /100 | #199 | Fair 4.9% |
| Basques | 23.3 /100 | #200 | Fair 4.9% |
| Immigrants | South America | 23.1 /100 | #201 | Fair 4.9% |
| Lumbee | 22.5 /100 | #202 | Fair 4.9% |
| Guamanians/Chamorros | 20.8 /100 | #203 | Fair 4.9% |
| Immigrants | Latvia | 18.5 /100 | #204 | Poor 4.9% |
| Haitians | 18.1 /100 | #205 | Poor 4.9% |
| Immigrants | Belarus | 14.1 /100 | #206 | Poor 4.9% |
| Immigrants | Australia | 14.1 /100 | #207 | Poor 4.9% |
| Immigrants | Kazakhstan | 14.0 /100 | #208 | Poor 4.9% |
| Immigrants | Haiti | 13.3 /100 | #209 | Poor 4.9% |
| Creek | 12.9 /100 | #210 | Poor 4.9% |
| Hawaiians | 12.8 /100 | #211 | Poor 4.9% |
| Immigrants | Nonimmigrants | 11.2 /100 | #212 | Poor 4.9% |
| Bermudans | 11.0 /100 | #213 | Poor 4.9% |
Demographics Similar to Immigrants from Kenya by Unemployment Among Ages 55 to 59 years
In terms of unemployment among ages 55 to 59 years, the demographic groups most similar to Immigrants from Kenya are Palestinian (4.5%, a difference of 0.020%), Immigrants from Eastern Africa (4.5%, a difference of 0.050%), German (4.5%, a difference of 0.080%), Immigrants from Zimbabwe (4.5%, a difference of 0.10%), and Scandinavian (4.5%, a difference of 0.11%).
| Demographics | Rating | Rank | Unemployment Among Ages 55 to 59 years |
| Kenyans | 100.0 /100 | #23 | Exceptional 4.4% |
| Jordanians | 100.0 /100 | #24 | Exceptional 4.4% |
| Immigrants | Eritrea | 100.0 /100 | #25 | Exceptional 4.4% |
| Scandinavians | 99.9 /100 | #26 | Exceptional 4.5% |
| Immigrants | Zimbabwe | 99.9 /100 | #27 | Exceptional 4.5% |
| Immigrants | Eastern Africa | 99.9 /100 | #28 | Exceptional 4.5% |
| Palestinians | 99.9 /100 | #29 | Exceptional 4.5% |
| Immigrants | Kenya | 99.9 /100 | #30 | Exceptional 4.5% |
| Germans | 99.9 /100 | #31 | Exceptional 4.5% |
| Immigrants | Ethiopia | 99.9 /100 | #32 | Exceptional 4.5% |
| Belgians | 99.9 /100 | #33 | Exceptional 4.5% |
| Thais | 99.9 /100 | #34 | Exceptional 4.5% |
| Cypriots | 99.9 /100 | #35 | Exceptional 4.5% |
| Ethiopians | 99.9 /100 | #36 | Exceptional 4.5% |
| Immigrants | Bulgaria | 99.9 /100 | #37 | Exceptional 4.5% |