Immigrants from Barbados vs Moroccan Unemployment Among Ages 35 to 44 years
COMPARE
Immigrants from Barbados
Moroccan
Unemployment Among Ages 35 to 44 years
Unemployment Among Ages 35 to 44 years Comparison
Immigrants from Barbados
Moroccans
5.8%
UNEMPLOYMENT AMONG AGES 35 TO 44 YEARS
0.0/ 100
METRIC RATING
309th/ 347
METRIC RANK
4.9%
UNEMPLOYMENT AMONG AGES 35 TO 44 YEARS
6.0/ 100
METRIC RATING
217th/ 347
METRIC RANK
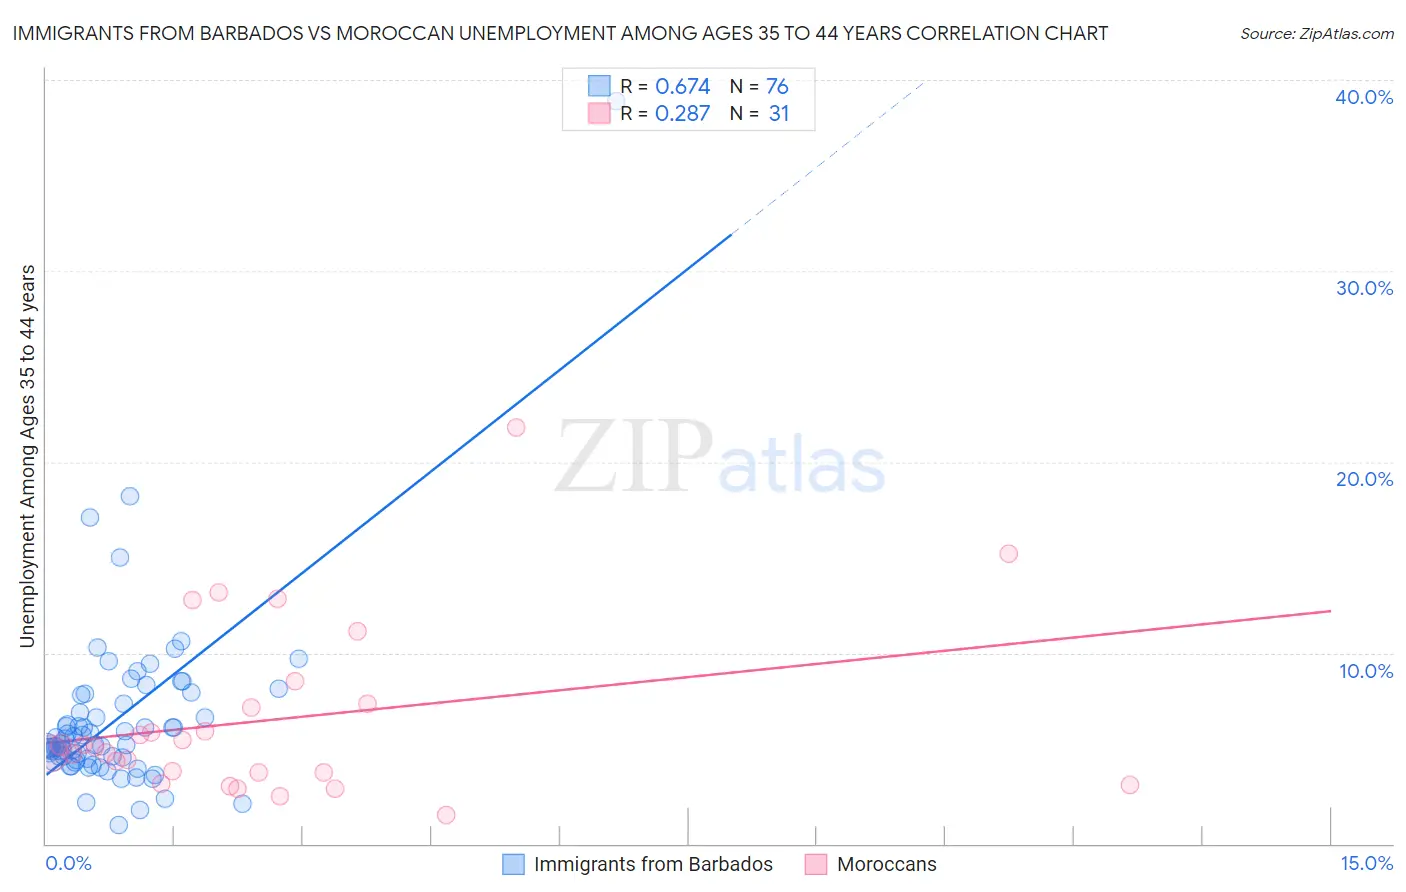
Immigrants from Barbados vs Moroccan Unemployment Among Ages 35 to 44 years Correlation Chart
The statistical analysis conducted on geographies consisting of 112,406,492 people shows a significant positive correlation between the proportion of Immigrants from Barbados and unemployment rate among population between the ages 35 and 44 in the United States with a correlation coefficient (R) of 0.674 and weighted average of 5.8%. Similarly, the statistical analysis conducted on geographies consisting of 200,434,316 people shows a weak positive correlation between the proportion of Moroccans and unemployment rate among population between the ages 35 and 44 in the United States with a correlation coefficient (R) of 0.287 and weighted average of 4.9%, a difference of 17.7%.
Unemployment Among Ages 35 to 44 years Correlation Summary
| Measurement | Immigrants from Barbados | Moroccan |
| Minimum | 1.0% | 1.5% |
| Maximum | 38.9% | 21.8% |
| Range | 37.9% | 20.3% |
| Mean | 6.5% | 6.5% |
| Median | 5.2% | 5.0% |
| Interquartile 25% (IQ1) | 4.4% | 3.7% |
| Interquartile 75% (IQ3) | 7.6% | 7.3% |
| Interquartile Range (IQR) | 3.2% | 3.6% |
| Standard Deviation (Sample) | 4.8% | 4.5% |
| Standard Deviation (Population) | 4.8% | 4.4% |
Similar Demographics by Unemployment Among Ages 35 to 44 years
Demographics Similar to Immigrants from Barbados by Unemployment Among Ages 35 to 44 years
In terms of unemployment among ages 35 to 44 years, the demographic groups most similar to Immigrants from Barbados are Immigrants from the Azores (5.8%, a difference of 0.29%), Immigrants from Belize (5.8%, a difference of 0.57%), Barbadian (5.7%, a difference of 1.1%), Guyanese (5.9%, a difference of 1.7%), and Marshallese (5.9%, a difference of 1.9%).
| Demographics | Rating | Rank | Unemployment Among Ages 35 to 44 years |
| Nepalese | 0.0 /100 | #302 | Tragic 5.6% |
| Yakama | 0.0 /100 | #303 | Tragic 5.6% |
| West Indians | 0.0 /100 | #304 | Tragic 5.7% |
| Belizeans | 0.0 /100 | #305 | Tragic 5.7% |
| Barbadians | 0.0 /100 | #306 | Tragic 5.7% |
| Immigrants | Belize | 0.0 /100 | #307 | Tragic 5.8% |
| Immigrants | Azores | 0.0 /100 | #308 | Tragic 5.8% |
| Immigrants | Barbados | 0.0 /100 | #309 | Tragic 5.8% |
| Guyanese | 0.0 /100 | #310 | Tragic 5.9% |
| Marshallese | 0.0 /100 | #311 | Tragic 5.9% |
| Immigrants | Guyana | 0.0 /100 | #312 | Tragic 6.0% |
| British West Indians | 0.0 /100 | #313 | Tragic 6.0% |
| Immigrants | Dominica | 0.0 /100 | #314 | Tragic 6.0% |
| Blacks/African Americans | 0.0 /100 | #315 | Tragic 6.1% |
| Tsimshian | 0.0 /100 | #316 | Tragic 6.2% |
Demographics Similar to Moroccans by Unemployment Among Ages 35 to 44 years
In terms of unemployment among ages 35 to 44 years, the demographic groups most similar to Moroccans are American (4.9%, a difference of 0.040%), Chickasaw (4.9%, a difference of 0.11%), Sierra Leonean (4.9%, a difference of 0.42%), Immigrants from Sierra Leone (4.9%, a difference of 0.45%), and Immigrants (4.9%, a difference of 0.51%).
| Demographics | Rating | Rank | Unemployment Among Ages 35 to 44 years |
| Immigrants | Cameroon | 11.4 /100 | #210 | Poor 4.9% |
| Immigrants | Nonimmigrants | 9.4 /100 | #211 | Tragic 4.9% |
| Fijians | 8.7 /100 | #212 | Tragic 4.9% |
| Osage | 8.6 /100 | #213 | Tragic 4.9% |
| Immigrants | Africa | 8.2 /100 | #214 | Tragic 4.9% |
| Immigrants | Immigrants | 8.0 /100 | #215 | Tragic 4.9% |
| Americans | 6.2 /100 | #216 | Tragic 4.9% |
| Moroccans | 6.0 /100 | #217 | Tragic 4.9% |
| Chickasaw | 5.7 /100 | #218 | Tragic 4.9% |
| Sierra Leoneans | 4.8 /100 | #219 | Tragic 4.9% |
| Immigrants | Sierra Leone | 4.7 /100 | #220 | Tragic 4.9% |
| Bermudans | 3.9 /100 | #221 | Tragic 5.0% |
| Hmong | 3.5 /100 | #222 | Tragic 5.0% |
| Immigrants | Panama | 3.3 /100 | #223 | Tragic 5.0% |
| Panamanians | 2.9 /100 | #224 | Tragic 5.0% |