Immigrants from Austria vs Moroccan Unemployment Among Ages 35 to 44 years
COMPARE
Immigrants from Austria
Moroccan
Unemployment Among Ages 35 to 44 years
Unemployment Among Ages 35 to 44 years Comparison
Immigrants from Austria
Moroccans
4.5%
UNEMPLOYMENT AMONG AGES 35 TO 44 YEARS
84.7/ 100
METRIC RATING
126th/ 347
METRIC RANK
4.9%
UNEMPLOYMENT AMONG AGES 35 TO 44 YEARS
6.0/ 100
METRIC RATING
217th/ 347
METRIC RANK
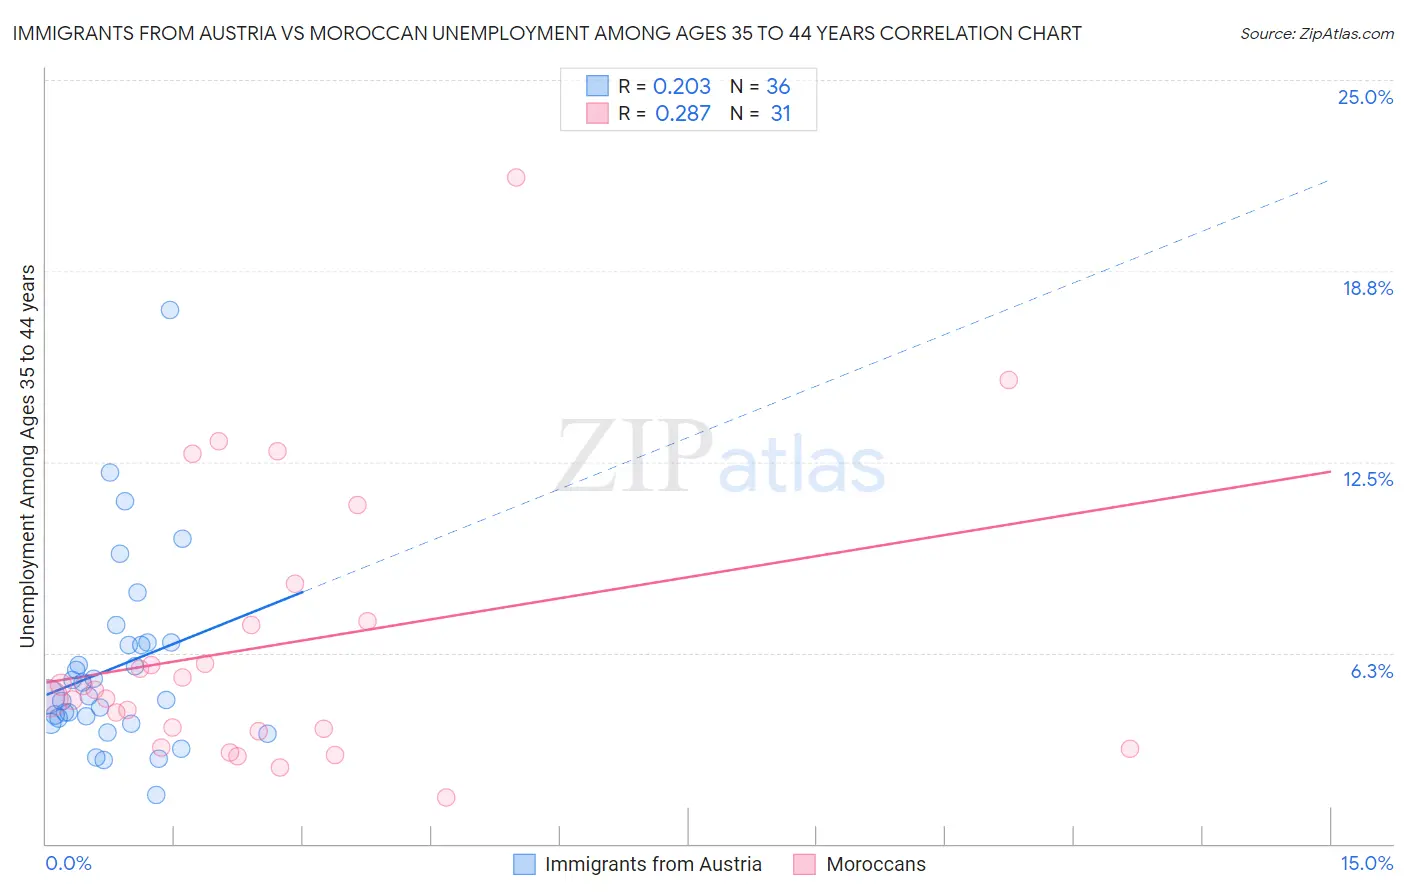
Immigrants from Austria vs Moroccan Unemployment Among Ages 35 to 44 years Correlation Chart
The statistical analysis conducted on geographies consisting of 166,253,059 people shows a weak positive correlation between the proportion of Immigrants from Austria and unemployment rate among population between the ages 35 and 44 in the United States with a correlation coefficient (R) of 0.203 and weighted average of 4.5%. Similarly, the statistical analysis conducted on geographies consisting of 200,434,316 people shows a weak positive correlation between the proportion of Moroccans and unemployment rate among population between the ages 35 and 44 in the United States with a correlation coefficient (R) of 0.287 and weighted average of 4.9%, a difference of 8.1%.
Unemployment Among Ages 35 to 44 years Correlation Summary
| Measurement | Immigrants from Austria | Moroccan |
| Minimum | 1.6% | 1.5% |
| Maximum | 17.5% | 21.8% |
| Range | 15.9% | 20.3% |
| Mean | 5.8% | 6.5% |
| Median | 4.8% | 5.0% |
| Interquartile 25% (IQ1) | 4.0% | 3.7% |
| Interquartile 75% (IQ3) | 6.6% | 7.3% |
| Interquartile Range (IQR) | 2.5% | 3.6% |
| Standard Deviation (Sample) | 3.1% | 4.5% |
| Standard Deviation (Population) | 3.0% | 4.4% |
Similar Demographics by Unemployment Among Ages 35 to 44 years
Demographics Similar to Immigrants from Austria by Unemployment Among Ages 35 to 44 years
In terms of unemployment among ages 35 to 44 years, the demographic groups most similar to Immigrants from Austria are Immigrants from Ethiopia (4.5%, a difference of 0.010%), Czechoslovakian (4.6%, a difference of 0.18%), Immigrants from Spain (4.5%, a difference of 0.20%), Immigrants from Northern Africa (4.5%, a difference of 0.20%), and Immigrants from Croatia (4.6%, a difference of 0.22%).
| Demographics | Rating | Rank | Unemployment Among Ages 35 to 44 years |
| Nicaraguans | 87.6 /100 | #119 | Excellent 4.5% |
| Ethiopians | 87.1 /100 | #120 | Excellent 4.5% |
| Immigrants | South Africa | 86.8 /100 | #121 | Excellent 4.5% |
| Sri Lankans | 86.8 /100 | #122 | Excellent 4.5% |
| Basques | 86.3 /100 | #123 | Excellent 4.5% |
| Immigrants | Spain | 86.1 /100 | #124 | Excellent 4.5% |
| Immigrants | Northern Africa | 86.1 /100 | #125 | Excellent 4.5% |
| Immigrants | Austria | 84.7 /100 | #126 | Excellent 4.5% |
| Immigrants | Ethiopia | 84.7 /100 | #127 | Excellent 4.5% |
| Czechoslovakians | 83.4 /100 | #128 | Excellent 4.6% |
| Immigrants | Croatia | 83.1 /100 | #129 | Excellent 4.6% |
| Immigrants | Eritrea | 82.8 /100 | #130 | Excellent 4.6% |
| Immigrants | Colombia | 82.6 /100 | #131 | Excellent 4.6% |
| Colombians | 80.8 /100 | #132 | Excellent 4.6% |
| Syrians | 80.7 /100 | #133 | Excellent 4.6% |
Demographics Similar to Moroccans by Unemployment Among Ages 35 to 44 years
In terms of unemployment among ages 35 to 44 years, the demographic groups most similar to Moroccans are American (4.9%, a difference of 0.040%), Chickasaw (4.9%, a difference of 0.11%), Sierra Leonean (4.9%, a difference of 0.42%), Immigrants from Sierra Leone (4.9%, a difference of 0.45%), and Immigrants (4.9%, a difference of 0.51%).
| Demographics | Rating | Rank | Unemployment Among Ages 35 to 44 years |
| Immigrants | Cameroon | 11.4 /100 | #210 | Poor 4.9% |
| Immigrants | Nonimmigrants | 9.4 /100 | #211 | Tragic 4.9% |
| Fijians | 8.7 /100 | #212 | Tragic 4.9% |
| Osage | 8.6 /100 | #213 | Tragic 4.9% |
| Immigrants | Africa | 8.2 /100 | #214 | Tragic 4.9% |
| Immigrants | Immigrants | 8.0 /100 | #215 | Tragic 4.9% |
| Americans | 6.2 /100 | #216 | Tragic 4.9% |
| Moroccans | 6.0 /100 | #217 | Tragic 4.9% |
| Chickasaw | 5.7 /100 | #218 | Tragic 4.9% |
| Sierra Leoneans | 4.8 /100 | #219 | Tragic 4.9% |
| Immigrants | Sierra Leone | 4.7 /100 | #220 | Tragic 4.9% |
| Bermudans | 3.9 /100 | #221 | Tragic 5.0% |
| Hmong | 3.5 /100 | #222 | Tragic 5.0% |
| Immigrants | Panama | 3.3 /100 | #223 | Tragic 5.0% |
| Panamanians | 2.9 /100 | #224 | Tragic 5.0% |