Immigrants from Bangladesh vs Immigrants from Zimbabwe Unemployment Among Youth under 25 years
COMPARE
Immigrants from Bangladesh
Immigrants from Zimbabwe
Unemployment Among Youth under 25 years
Unemployment Among Youth under 25 years Comparison
Immigrants from Bangladesh
Immigrants from Zimbabwe
14.2%
UNEMPLOYMENT AMONG YOUTH UNDER 25 YEARS
0.0/ 100
METRIC RATING
311th/ 347
METRIC RANK
10.8%
UNEMPLOYMENT AMONG YOUTH UNDER 25 YEARS
99.8/ 100
METRIC RATING
37th/ 347
METRIC RANK
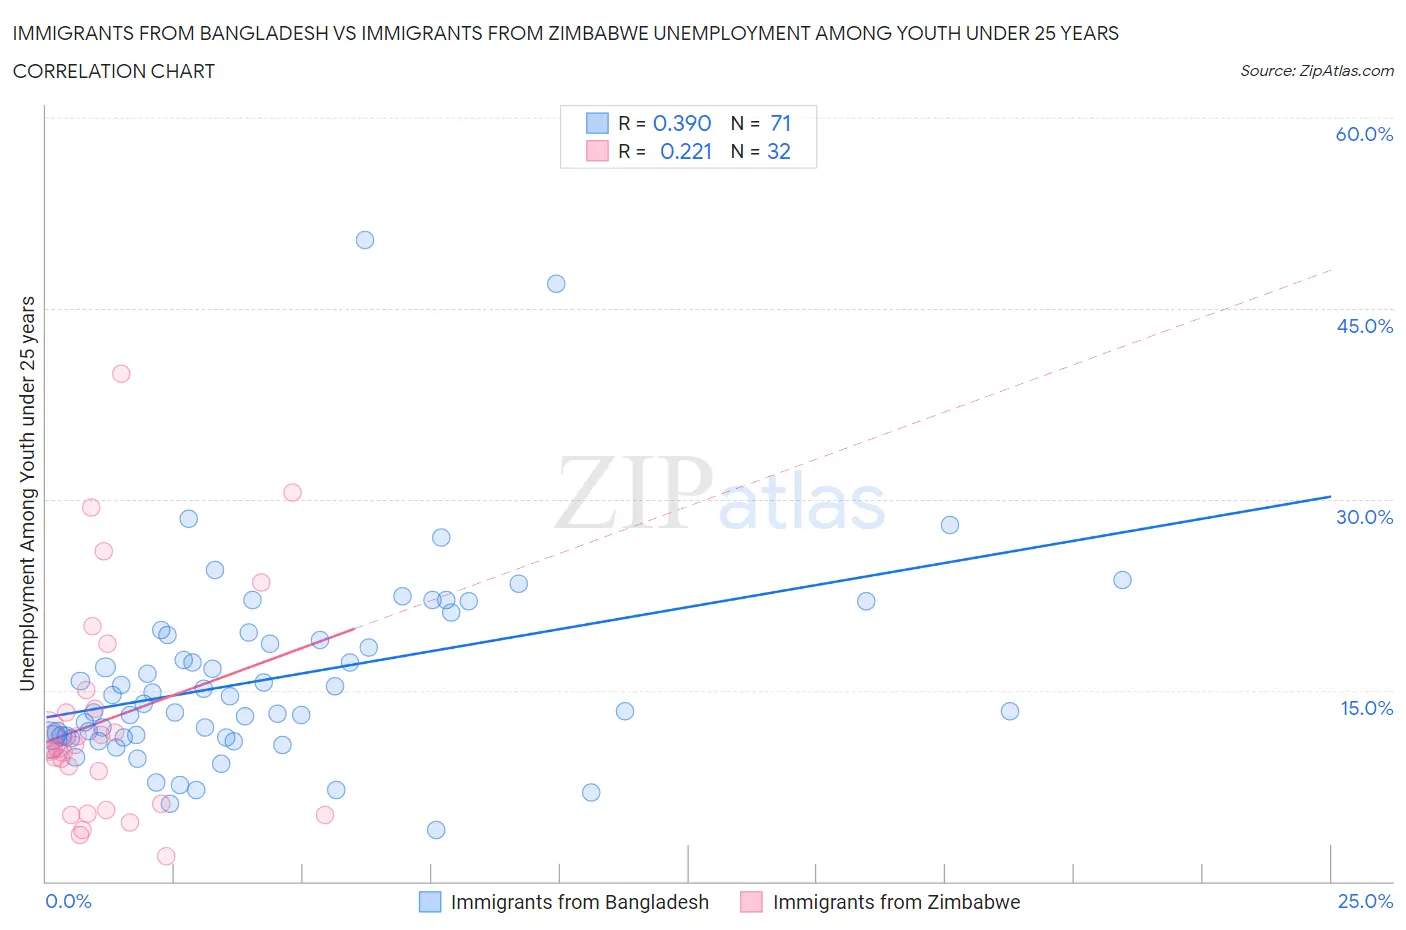
Immigrants from Bangladesh vs Immigrants from Zimbabwe Unemployment Among Youth under 25 years Correlation Chart
The statistical analysis conducted on geographies consisting of 202,878,675 people shows a mild positive correlation between the proportion of Immigrants from Bangladesh and unemployment rate among youth under the age of 25 in the United States with a correlation coefficient (R) of 0.390 and weighted average of 14.2%. Similarly, the statistical analysis conducted on geographies consisting of 117,412,367 people shows a weak positive correlation between the proportion of Immigrants from Zimbabwe and unemployment rate among youth under the age of 25 in the United States with a correlation coefficient (R) of 0.221 and weighted average of 10.8%, a difference of 31.0%.
Unemployment Among Youth under 25 years Correlation Summary
| Measurement | Immigrants from Bangladesh | Immigrants from Zimbabwe |
| Minimum | 4.0% | 2.0% |
| Maximum | 50.4% | 39.9% |
| Range | 46.4% | 37.9% |
| Mean | 16.0% | 12.7% |
| Median | 14.0% | 10.4% |
| Interquartile 25% (IQ1) | 11.3% | 5.8% |
| Interquartile 75% (IQ3) | 19.3% | 14.3% |
| Interquartile Range (IQR) | 8.0% | 8.5% |
| Standard Deviation (Sample) | 7.8% | 8.8% |
| Standard Deviation (Population) | 7.7% | 8.7% |
Similar Demographics by Unemployment Among Youth under 25 years
Demographics Similar to Immigrants from Bangladesh by Unemployment Among Youth under 25 years
In terms of unemployment among youth under 25 years, the demographic groups most similar to Immigrants from Bangladesh are Immigrants from West Indies (14.2%, a difference of 0.030%), Vietnamese (14.3%, a difference of 0.31%), Aleut (14.1%, a difference of 0.57%), Immigrants from Armenia (14.4%, a difference of 1.1%), and Jamaican (14.4%, a difference of 1.2%).
| Demographics | Rating | Rank | Unemployment Among Youth under 25 years |
| Houma | 0.0 /100 | #304 | Tragic 13.8% |
| Haitians | 0.0 /100 | #305 | Tragic 13.9% |
| Pueblo | 0.0 /100 | #306 | Tragic 13.9% |
| Immigrants | Haiti | 0.0 /100 | #307 | Tragic 14.0% |
| Immigrants | Belize | 0.0 /100 | #308 | Tragic 14.0% |
| Aleuts | 0.0 /100 | #309 | Tragic 14.1% |
| Immigrants | West Indies | 0.0 /100 | #310 | Tragic 14.2% |
| Immigrants | Bangladesh | 0.0 /100 | #311 | Tragic 14.2% |
| Vietnamese | 0.0 /100 | #312 | Tragic 14.3% |
| Immigrants | Armenia | 0.0 /100 | #313 | Tragic 14.4% |
| Jamaicans | 0.0 /100 | #314 | Tragic 14.4% |
| Sioux | 0.0 /100 | #315 | Tragic 14.4% |
| Natives/Alaskans | 0.0 /100 | #316 | Tragic 14.5% |
| Blacks/African Americans | 0.0 /100 | #317 | Tragic 14.5% |
| Immigrants | Dominica | 0.0 /100 | #318 | Tragic 14.6% |
Demographics Similar to Immigrants from Zimbabwe by Unemployment Among Youth under 25 years
In terms of unemployment among youth under 25 years, the demographic groups most similar to Immigrants from Zimbabwe are Immigrants from Congo (10.9%, a difference of 0.070%), Immigrants from Zaire (10.9%, a difference of 0.080%), Hmong (10.8%, a difference of 0.15%), Scottish (10.9%, a difference of 0.24%), and Immigrants from Nepal (10.8%, a difference of 0.29%).
| Demographics | Rating | Rank | Unemployment Among Youth under 25 years |
| Osage | 99.9 /100 | #30 | Exceptional 10.7% |
| Slovenes | 99.9 /100 | #31 | Exceptional 10.7% |
| Taiwanese | 99.9 /100 | #32 | Exceptional 10.8% |
| Europeans | 99.9 /100 | #33 | Exceptional 10.8% |
| English | 99.9 /100 | #34 | Exceptional 10.8% |
| Immigrants | Nepal | 99.9 /100 | #35 | Exceptional 10.8% |
| Hmong | 99.8 /100 | #36 | Exceptional 10.8% |
| Immigrants | Zimbabwe | 99.8 /100 | #37 | Exceptional 10.8% |
| Immigrants | Congo | 99.8 /100 | #38 | Exceptional 10.9% |
| Immigrants | Zaire | 99.8 /100 | #39 | Exceptional 10.9% |
| Scottish | 99.8 /100 | #40 | Exceptional 10.9% |
| Croatians | 99.8 /100 | #41 | Exceptional 10.9% |
| Cambodians | 99.7 /100 | #42 | Exceptional 10.9% |
| British | 99.7 /100 | #43 | Exceptional 10.9% |
| Welsh | 99.7 /100 | #44 | Exceptional 10.9% |