Immigrants from Bangladesh vs Immigrants from Australia Unemployment Among Youth under 25 years
COMPARE
Immigrants from Bangladesh
Immigrants from Australia
Unemployment Among Youth under 25 years
Unemployment Among Youth under 25 years Comparison
Immigrants from Bangladesh
Immigrants from Australia
14.2%
UNEMPLOYMENT AMONG YOUTH UNDER 25 YEARS
0.0/ 100
METRIC RATING
311th/ 347
METRIC RANK
11.2%
UNEMPLOYMENT AMONG YOUTH UNDER 25 YEARS
97.3/ 100
METRIC RATING
72nd/ 347
METRIC RANK
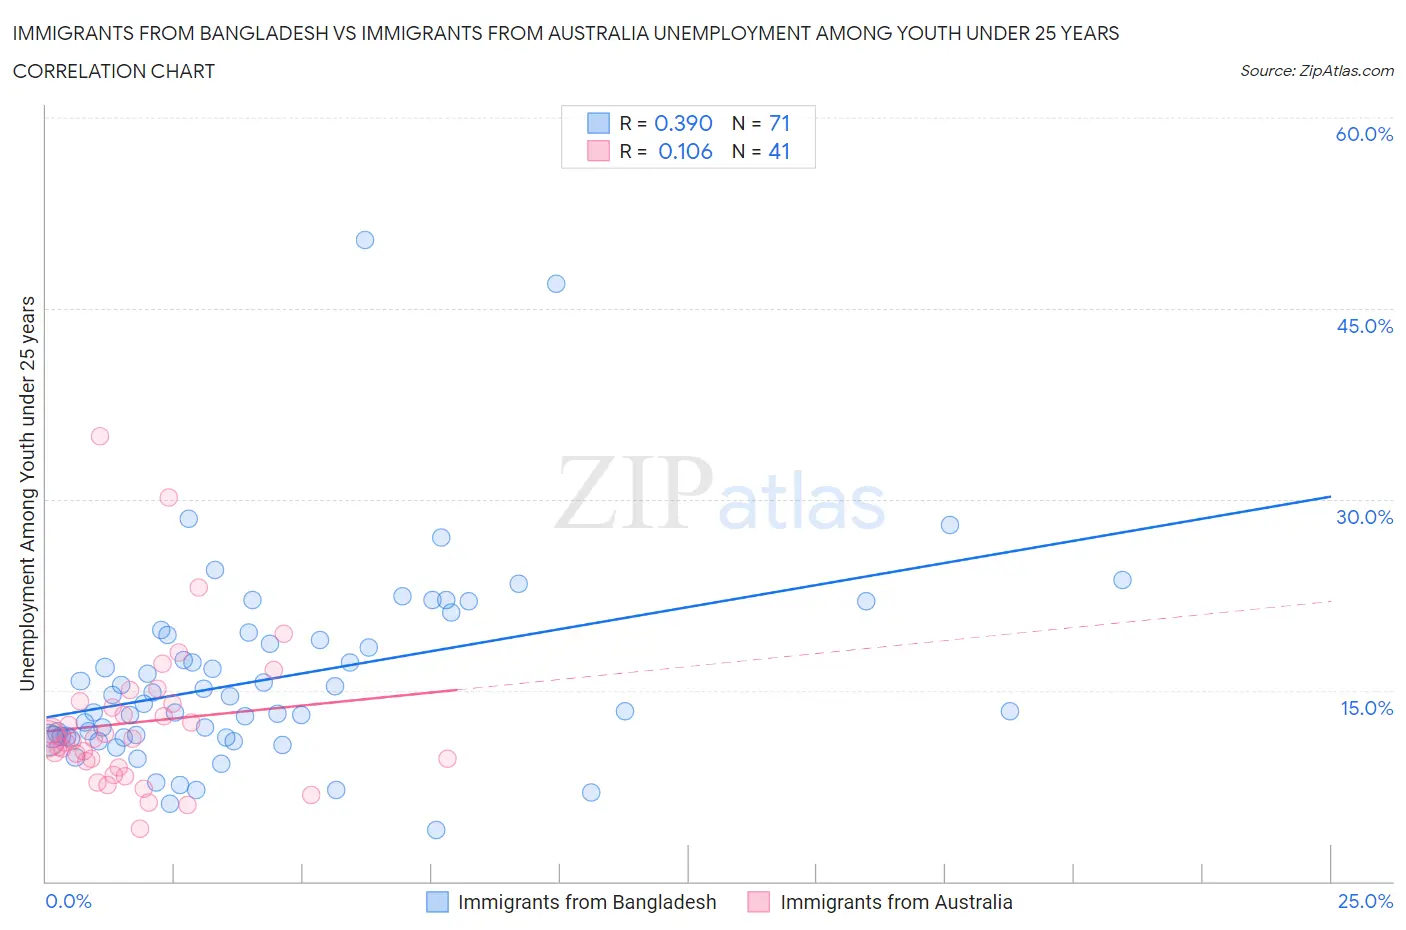
Immigrants from Bangladesh vs Immigrants from Australia Unemployment Among Youth under 25 years Correlation Chart
The statistical analysis conducted on geographies consisting of 202,878,675 people shows a mild positive correlation between the proportion of Immigrants from Bangladesh and unemployment rate among youth under the age of 25 in the United States with a correlation coefficient (R) of 0.390 and weighted average of 14.2%. Similarly, the statistical analysis conducted on geographies consisting of 225,367,342 people shows a poor positive correlation between the proportion of Immigrants from Australia and unemployment rate among youth under the age of 25 in the United States with a correlation coefficient (R) of 0.106 and weighted average of 11.2%, a difference of 27.1%.
Unemployment Among Youth under 25 years Correlation Summary
| Measurement | Immigrants from Bangladesh | Immigrants from Australia |
| Minimum | 4.0% | 4.2% |
| Maximum | 50.4% | 34.9% |
| Range | 46.4% | 30.8% |
| Mean | 16.0% | 12.5% |
| Median | 14.0% | 11.2% |
| Interquartile 25% (IQ1) | 11.3% | 9.2% |
| Interquartile 75% (IQ3) | 19.3% | 14.0% |
| Interquartile Range (IQR) | 8.0% | 4.8% |
| Standard Deviation (Sample) | 7.8% | 6.0% |
| Standard Deviation (Population) | 7.7% | 5.9% |
Similar Demographics by Unemployment Among Youth under 25 years
Demographics Similar to Immigrants from Bangladesh by Unemployment Among Youth under 25 years
In terms of unemployment among youth under 25 years, the demographic groups most similar to Immigrants from Bangladesh are Immigrants from West Indies (14.2%, a difference of 0.030%), Vietnamese (14.3%, a difference of 0.31%), Aleut (14.1%, a difference of 0.57%), Immigrants from Armenia (14.4%, a difference of 1.1%), and Jamaican (14.4%, a difference of 1.2%).
| Demographics | Rating | Rank | Unemployment Among Youth under 25 years |
| Houma | 0.0 /100 | #304 | Tragic 13.8% |
| Haitians | 0.0 /100 | #305 | Tragic 13.9% |
| Pueblo | 0.0 /100 | #306 | Tragic 13.9% |
| Immigrants | Haiti | 0.0 /100 | #307 | Tragic 14.0% |
| Immigrants | Belize | 0.0 /100 | #308 | Tragic 14.0% |
| Aleuts | 0.0 /100 | #309 | Tragic 14.1% |
| Immigrants | West Indies | 0.0 /100 | #310 | Tragic 14.2% |
| Immigrants | Bangladesh | 0.0 /100 | #311 | Tragic 14.2% |
| Vietnamese | 0.0 /100 | #312 | Tragic 14.3% |
| Immigrants | Armenia | 0.0 /100 | #313 | Tragic 14.4% |
| Jamaicans | 0.0 /100 | #314 | Tragic 14.4% |
| Sioux | 0.0 /100 | #315 | Tragic 14.4% |
| Natives/Alaskans | 0.0 /100 | #316 | Tragic 14.5% |
| Blacks/African Americans | 0.0 /100 | #317 | Tragic 14.5% |
| Immigrants | Dominica | 0.0 /100 | #318 | Tragic 14.6% |
Demographics Similar to Immigrants from Australia by Unemployment Among Youth under 25 years
In terms of unemployment among youth under 25 years, the demographic groups most similar to Immigrants from Australia are Bhutanese (11.2%, a difference of 0.040%), Creek (11.2%, a difference of 0.050%), New Zealander (11.2%, a difference of 0.060%), Slavic (11.2%, a difference of 0.080%), and Immigrants from Moldova (11.2%, a difference of 0.090%).
| Demographics | Rating | Rank | Unemployment Among Youth under 25 years |
| Immigrants | Singapore | 97.8 /100 | #65 | Exceptional 11.2% |
| Macedonians | 97.7 /100 | #66 | Exceptional 11.2% |
| Chickasaw | 97.7 /100 | #67 | Exceptional 11.2% |
| Immigrants | Kenya | 97.6 /100 | #68 | Exceptional 11.2% |
| Immigrants | Moldova | 97.5 /100 | #69 | Exceptional 11.2% |
| Slavs | 97.5 /100 | #70 | Exceptional 11.2% |
| Bhutanese | 97.4 /100 | #71 | Exceptional 11.2% |
| Immigrants | Australia | 97.3 /100 | #72 | Exceptional 11.2% |
| Creek | 97.2 /100 | #73 | Exceptional 11.2% |
| New Zealanders | 97.2 /100 | #74 | Exceptional 11.2% |
| French | 97.1 /100 | #75 | Exceptional 11.2% |
| German Russians | 97.0 /100 | #76 | Exceptional 11.2% |
| Whites/Caucasians | 96.9 /100 | #77 | Exceptional 11.2% |
| Immigrants | Nicaragua | 96.7 /100 | #78 | Exceptional 11.2% |
| Immigrants | Canada | 96.7 /100 | #79 | Exceptional 11.2% |