Immigrants from the Azores vs Colville Unemployment
COMPARE
Immigrants from the Azores
Colville
Unemployment
Unemployment Comparison
Immigrants from the Azores
Colville
6.1%
UNEMPLOYMENT
0.0/ 100
METRIC RATING
282nd/ 347
METRIC RANK
6.6%
UNEMPLOYMENT
0.0/ 100
METRIC RATING
312th/ 347
METRIC RANK
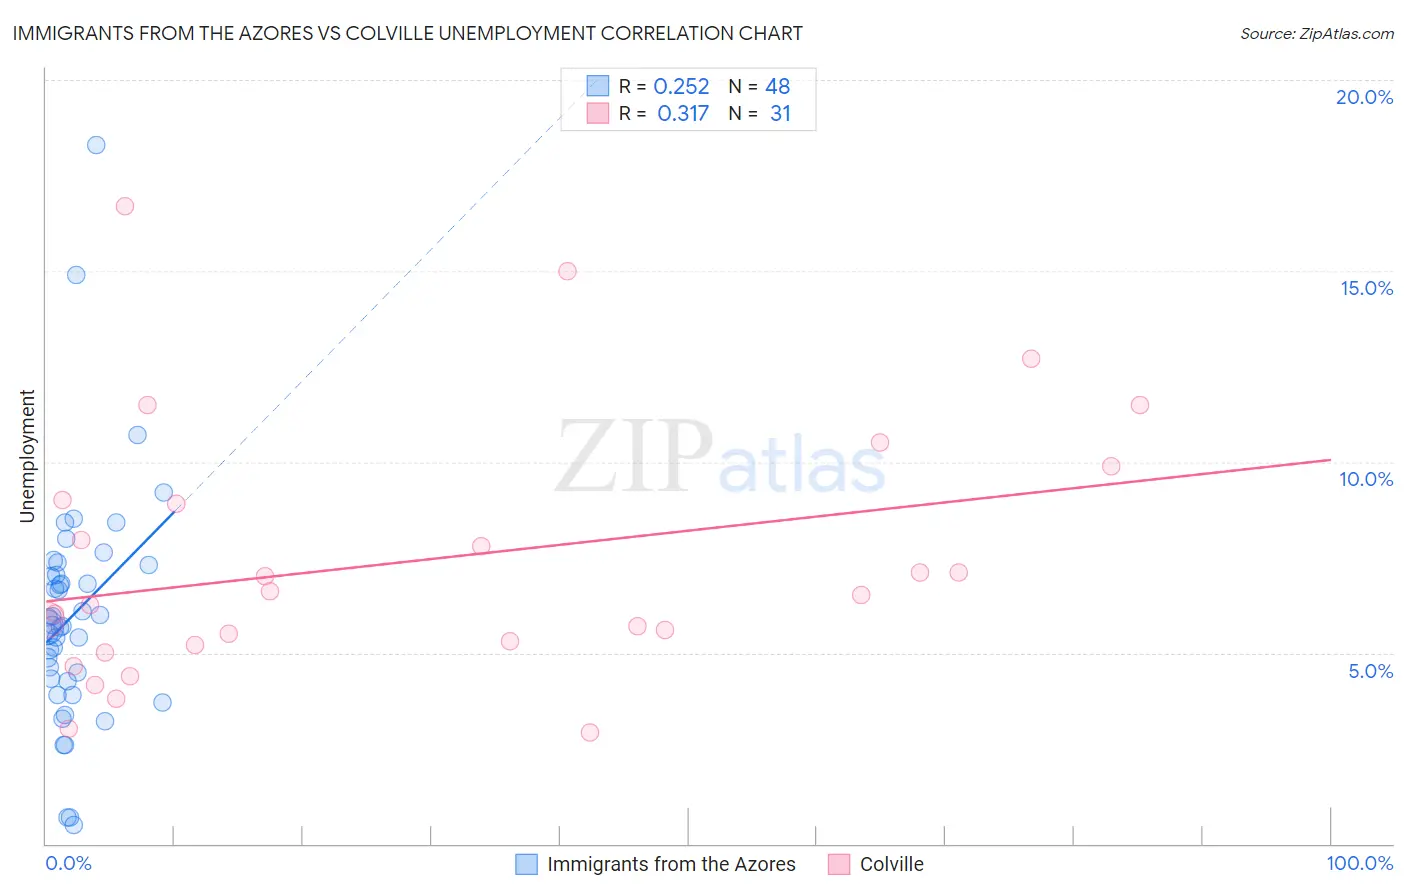
Immigrants from the Azores vs Colville Unemployment Correlation Chart
The statistical analysis conducted on geographies consisting of 46,243,359 people shows a weak positive correlation between the proportion of Immigrants from the Azores and unemployment in the United States with a correlation coefficient (R) of 0.252 and weighted average of 6.1%. Similarly, the statistical analysis conducted on geographies consisting of 34,675,469 people shows a mild positive correlation between the proportion of Colville and unemployment in the United States with a correlation coefficient (R) of 0.317 and weighted average of 6.6%, a difference of 8.5%.
Unemployment Correlation Summary
| Measurement | Immigrants from the Azores | Colville |
| Minimum | 0.50% | 2.9% |
| Maximum | 18.3% | 16.7% |
| Range | 17.8% | 13.8% |
| Mean | 6.0% | 7.4% |
| Median | 5.7% | 6.5% |
| Interquartile 25% (IQ1) | 4.3% | 5.2% |
| Interquartile 75% (IQ3) | 7.2% | 9.0% |
| Interquartile Range (IQR) | 2.9% | 3.8% |
| Standard Deviation (Sample) | 3.1% | 3.4% |
| Standard Deviation (Population) | 3.1% | 3.3% |
Similar Demographics by Unemployment
Demographics Similar to Immigrants from the Azores by Unemployment
In terms of unemployment, the demographic groups most similar to Immigrants from the Azores are African (6.1%, a difference of 0.060%), Immigrants from Ghana (6.1%, a difference of 0.080%), Aleut (6.1%, a difference of 0.21%), Immigrants from Western Africa (6.0%, a difference of 0.64%), and Immigrants from Mexico (6.0%, a difference of 0.65%).
| Demographics | Rating | Rank | Unemployment |
| Immigrants | Latin America | 0.0 /100 | #275 | Tragic 5.9% |
| Immigrants | Central America | 0.0 /100 | #276 | Tragic 6.0% |
| Armenians | 0.0 /100 | #277 | Tragic 6.0% |
| Ghanaians | 0.0 /100 | #278 | Tragic 6.0% |
| Immigrants | Mexico | 0.0 /100 | #279 | Tragic 6.0% |
| Immigrants | Western Africa | 0.0 /100 | #280 | Tragic 6.0% |
| Africans | 0.0 /100 | #281 | Tragic 6.1% |
| Immigrants | Azores | 0.0 /100 | #282 | Tragic 6.1% |
| Immigrants | Ghana | 0.0 /100 | #283 | Tragic 6.1% |
| Aleuts | 0.0 /100 | #284 | Tragic 6.1% |
| Immigrants | Senegal | 0.0 /100 | #285 | Tragic 6.1% |
| Immigrants | Caribbean | 0.0 /100 | #286 | Tragic 6.2% |
| Nepalese | 0.0 /100 | #287 | Tragic 6.2% |
| Ecuadorians | 0.0 /100 | #288 | Tragic 6.2% |
| Chippewa | 0.0 /100 | #289 | Tragic 6.2% |
Demographics Similar to Colville by Unemployment
In terms of unemployment, the demographic groups most similar to Colville are Immigrants from Barbados (6.6%, a difference of 0.38%), Cape Verdean (6.5%, a difference of 0.57%), Immigrants from Belize (6.5%, a difference of 0.91%), Black/African American (6.6%, a difference of 0.93%), and Vietnamese (6.5%, a difference of 1.2%).
| Demographics | Rating | Rank | Unemployment |
| Menominee | 0.0 /100 | #305 | Tragic 6.4% |
| Lumbee | 0.0 /100 | #306 | Tragic 6.4% |
| Immigrants | Bangladesh | 0.0 /100 | #307 | Tragic 6.5% |
| Barbadians | 0.0 /100 | #308 | Tragic 6.5% |
| Vietnamese | 0.0 /100 | #309 | Tragic 6.5% |
| Immigrants | Belize | 0.0 /100 | #310 | Tragic 6.5% |
| Cape Verdeans | 0.0 /100 | #311 | Tragic 6.5% |
| Colville | 0.0 /100 | #312 | Tragic 6.6% |
| Immigrants | Barbados | 0.0 /100 | #313 | Tragic 6.6% |
| Blacks/African Americans | 0.0 /100 | #314 | Tragic 6.6% |
| Houma | 0.0 /100 | #315 | Tragic 6.7% |
| Immigrants | Dominica | 0.0 /100 | #316 | Tragic 6.7% |
| Shoshone | 0.0 /100 | #317 | Tragic 6.8% |
| Immigrants | Cabo Verde | 0.0 /100 | #318 | Tragic 6.8% |
| British West Indians | 0.0 /100 | #319 | Tragic 6.8% |