Icelander vs Yugoslavian Unemployment Among Ages 16 to 19 years
COMPARE
Icelander
Yugoslavian
Unemployment Among Ages 16 to 19 years
Unemployment Among Ages 16 to 19 years Comparison
Icelanders
Yugoslavians
17.0%
UNEMPLOYMENT AMONG AGES 16 TO 19 YEARS
93.4/ 100
METRIC RATING
113th/ 347
METRIC RANK
15.6%
UNEMPLOYMENT AMONG AGES 16 TO 19 YEARS
100.0/ 100
METRIC RATING
15th/ 347
METRIC RANK
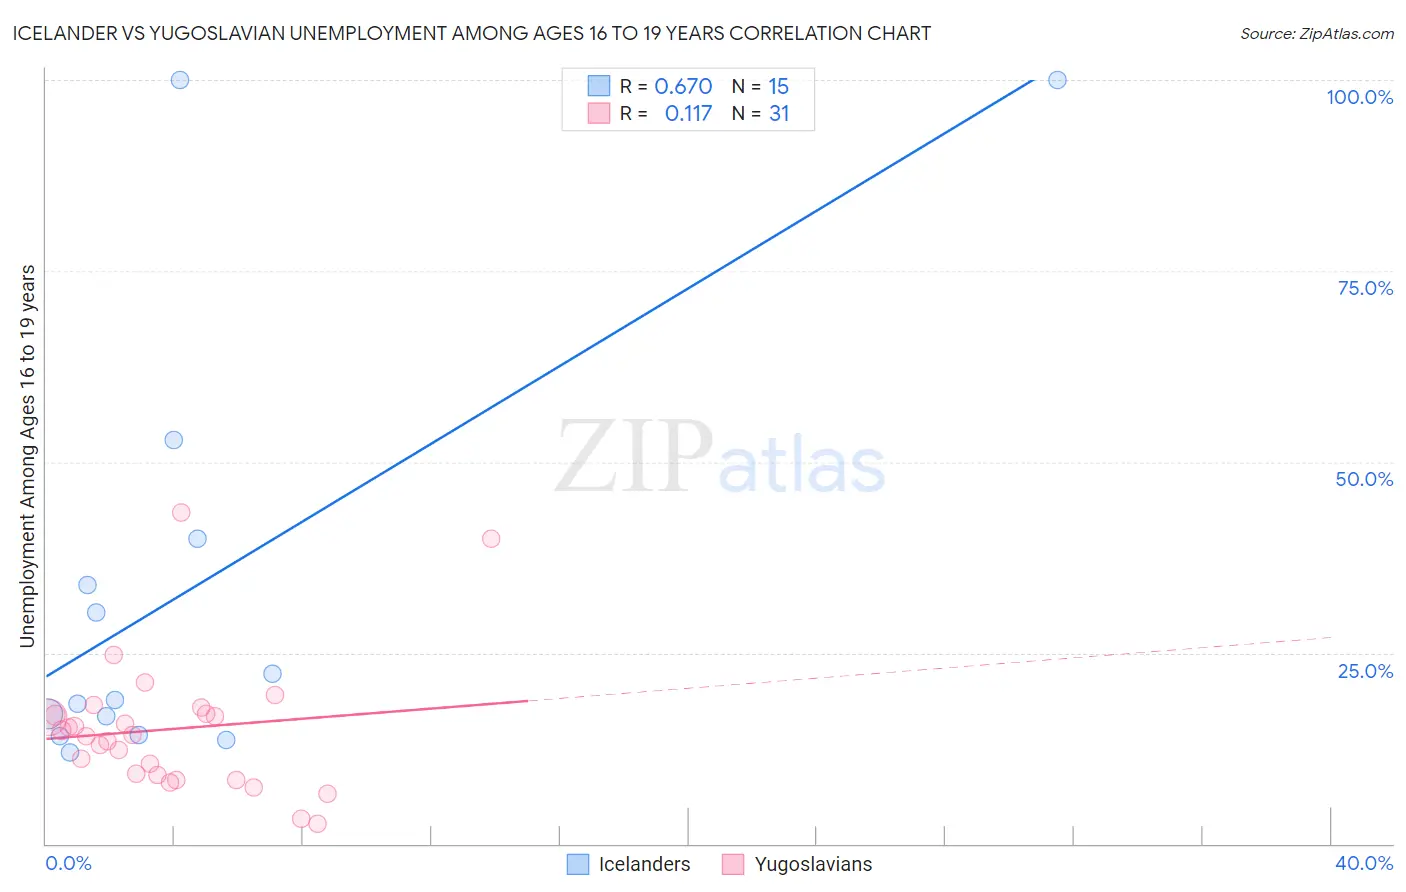
Icelander vs Yugoslavian Unemployment Among Ages 16 to 19 years Correlation Chart
The statistical analysis conducted on geographies consisting of 155,540,667 people shows a significant positive correlation between the proportion of Icelanders and unemployment rate among population between the ages 16 and 19 in the United States with a correlation coefficient (R) of 0.670 and weighted average of 17.0%. Similarly, the statistical analysis conducted on geographies consisting of 274,198,051 people shows a poor positive correlation between the proportion of Yugoslavians and unemployment rate among population between the ages 16 and 19 in the United States with a correlation coefficient (R) of 0.117 and weighted average of 15.6%, a difference of 9.0%.
Unemployment Among Ages 16 to 19 years Correlation Summary
| Measurement | Icelander | Yugoslavian |
| Minimum | 11.9% | 2.7% |
| Maximum | 100.0% | 43.3% |
| Range | 88.1% | 40.6% |
| Mean | 33.6% | 15.0% |
| Median | 18.8% | 14.3% |
| Interquartile 25% (IQ1) | 14.2% | 9.0% |
| Interquartile 75% (IQ3) | 40.0% | 17.0% |
| Interquartile Range (IQR) | 25.8% | 7.9% |
| Standard Deviation (Sample) | 29.3% | 8.7% |
| Standard Deviation (Population) | 28.3% | 8.6% |
Similar Demographics by Unemployment Among Ages 16 to 19 years
Demographics Similar to Icelanders by Unemployment Among Ages 16 to 19 years
In terms of unemployment among ages 16 to 19 years, the demographic groups most similar to Icelanders are Immigrants from Iraq (17.0%, a difference of 0.060%), Immigrants from Poland (17.0%, a difference of 0.070%), Immigrants from Asia (17.0%, a difference of 0.090%), Immigrants from Netherlands (17.0%, a difference of 0.11%), and Iranian (17.0%, a difference of 0.14%).
| Demographics | Rating | Rank | Unemployment Among Ages 16 to 19 years |
| Estonians | 94.3 /100 | #106 | Exceptional 17.0% |
| Immigrants | Brazil | 94.2 /100 | #107 | Exceptional 17.0% |
| Malaysians | 94.2 /100 | #108 | Exceptional 17.0% |
| Iranians | 94.1 /100 | #109 | Exceptional 17.0% |
| Immigrants | Netherlands | 93.9 /100 | #110 | Exceptional 17.0% |
| Immigrants | Asia | 93.9 /100 | #111 | Exceptional 17.0% |
| Immigrants | Iraq | 93.7 /100 | #112 | Exceptional 17.0% |
| Icelanders | 93.4 /100 | #113 | Exceptional 17.0% |
| Immigrants | Poland | 93.1 /100 | #114 | Exceptional 17.0% |
| Brazilians | 92.3 /100 | #115 | Exceptional 17.1% |
| Immigrants | Korea | 92.2 /100 | #116 | Exceptional 17.1% |
| Immigrants | Sri Lanka | 92.0 /100 | #117 | Exceptional 17.1% |
| Venezuelans | 91.8 /100 | #118 | Exceptional 17.1% |
| Hungarians | 91.6 /100 | #119 | Exceptional 17.1% |
| Immigrants | Middle Africa | 90.9 /100 | #120 | Exceptional 17.1% |
Demographics Similar to Yugoslavians by Unemployment Among Ages 16 to 19 years
In terms of unemployment among ages 16 to 19 years, the demographic groups most similar to Yugoslavians are Immigrants from Zaire (15.6%, a difference of 0.050%), Immigrants from Burma/Myanmar (15.6%, a difference of 0.20%), German (15.7%, a difference of 0.29%), Somali (15.7%, a difference of 0.50%), and Taiwanese (15.5%, a difference of 0.63%).
| Demographics | Rating | Rank | Unemployment Among Ages 16 to 19 years |
| Czechs | 100.0 /100 | #8 | Exceptional 15.4% |
| Scandinavians | 100.0 /100 | #9 | Exceptional 15.4% |
| Zimbabweans | 100.0 /100 | #10 | Exceptional 15.4% |
| Indonesians | 100.0 /100 | #11 | Exceptional 15.5% |
| Taiwanese | 100.0 /100 | #12 | Exceptional 15.5% |
| Immigrants | Burma/Myanmar | 100.0 /100 | #13 | Exceptional 15.6% |
| Immigrants | Zaire | 100.0 /100 | #14 | Exceptional 15.6% |
| Yugoslavians | 100.0 /100 | #15 | Exceptional 15.6% |
| Germans | 100.0 /100 | #16 | Exceptional 15.7% |
| Somalis | 100.0 /100 | #17 | Exceptional 15.7% |
| Thais | 100.0 /100 | #18 | Exceptional 15.7% |
| Swiss | 100.0 /100 | #19 | Exceptional 15.8% |
| Sudanese | 100.0 /100 | #20 | Exceptional 15.8% |
| Immigrants | Taiwan | 100.0 /100 | #21 | Exceptional 15.8% |
| Finns | 100.0 /100 | #22 | Exceptional 15.9% |