Icelander vs Yugoslavian 12th Grade, No Diploma
COMPARE
Icelander
Yugoslavian
12th Grade, No Diploma
12th Grade, No Diploma Comparison
Icelanders
Yugoslavians
92.3%
12TH GRADE, NO DIPLOMA
98.5/ 100
METRIC RATING
96th/ 347
METRIC RANK
92.1%
12TH GRADE, NO DIPLOMA
96.5/ 100
METRIC RATING
114th/ 347
METRIC RANK
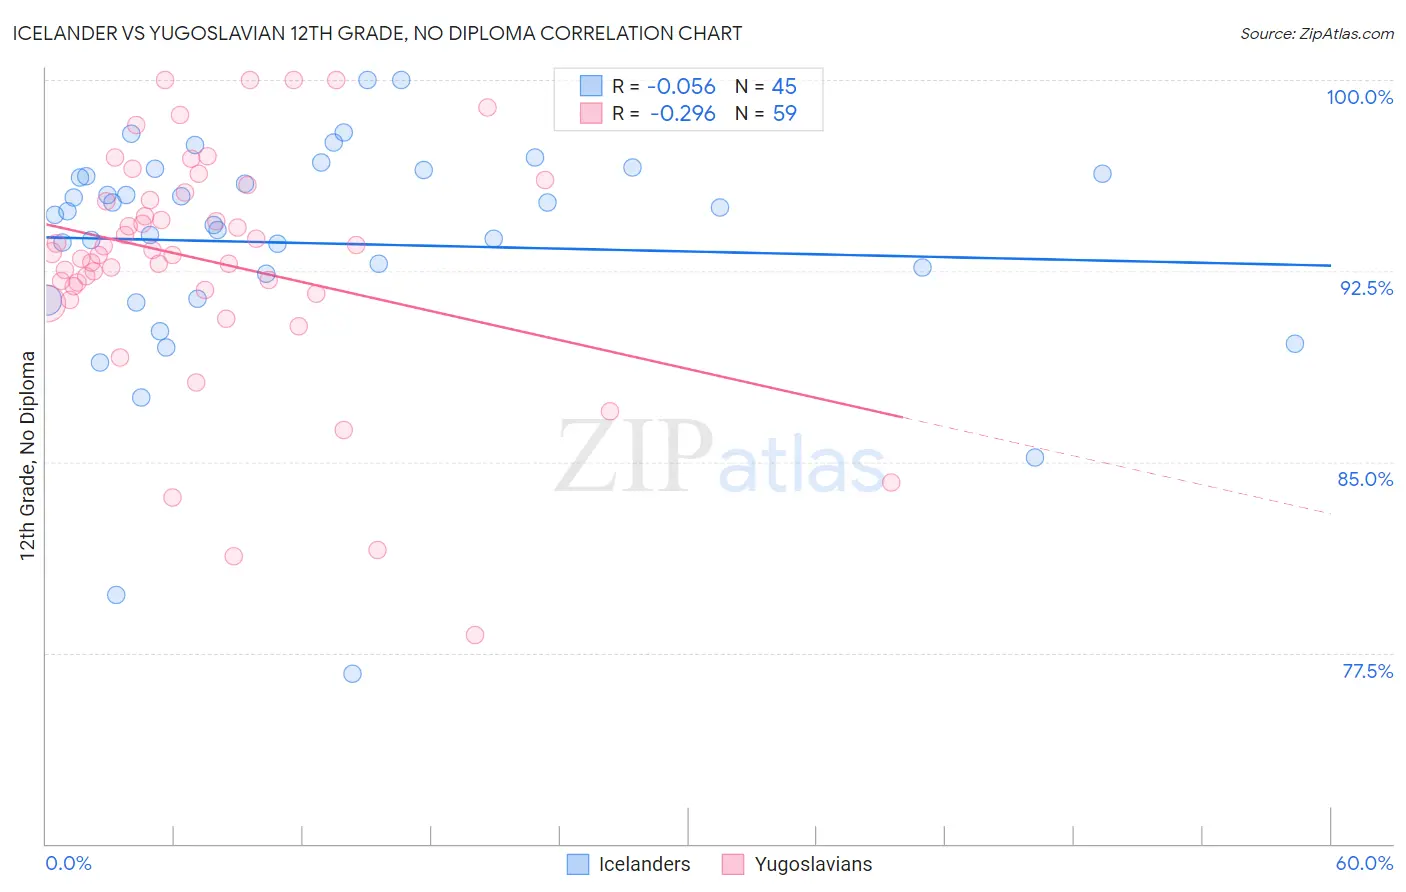
Icelander vs Yugoslavian 12th Grade, No Diploma Correlation Chart
The statistical analysis conducted on geographies consisting of 159,668,816 people shows a slight negative correlation between the proportion of Icelanders and percentage of population with at least 12th grade (no diploma) education in the United States with a correlation coefficient (R) of -0.056 and weighted average of 92.3%. Similarly, the statistical analysis conducted on geographies consisting of 285,719,638 people shows a weak negative correlation between the proportion of Yugoslavians and percentage of population with at least 12th grade (no diploma) education in the United States with a correlation coefficient (R) of -0.296 and weighted average of 92.1%, a difference of 0.26%.
12th Grade, No Diploma Correlation Summary
| Measurement | Icelander | Yugoslavian |
| Minimum | 76.7% | 78.2% |
| Maximum | 100.0% | 100.0% |
| Range | 23.3% | 21.8% |
| Mean | 93.6% | 92.9% |
| Median | 94.9% | 93.2% |
| Interquartile 25% (IQ1) | 91.9% | 91.8% |
| Interquartile 75% (IQ3) | 96.4% | 95.6% |
| Interquartile Range (IQR) | 4.5% | 3.8% |
| Standard Deviation (Sample) | 4.6% | 4.6% |
| Standard Deviation (Population) | 4.5% | 4.5% |
Demographics Similar to Icelanders and Yugoslavians by 12th Grade, No Diploma
In terms of 12th grade, no diploma, the demographic groups most similar to Icelanders are Immigrants from North Macedonia (92.3%, a difference of 0.0%), Celtic (92.3%, a difference of 0.010%), Immigrants from Kuwait (92.3%, a difference of 0.010%), Immigrants from Korea (92.3%, a difference of 0.020%), and Immigrants from Croatia (92.3%, a difference of 0.030%). Similarly, the demographic groups most similar to Yugoslavians are Immigrants from Zimbabwe (92.1%, a difference of 0.0%), Immigrants from Sri Lanka (92.1%, a difference of 0.010%), Israeli (92.1%, a difference of 0.030%), Immigrants from Hungary (92.1%, a difference of 0.050%), and Palestinian (92.1%, a difference of 0.050%).
| Demographics | Rating | Rank | 12th Grade, No Diploma |
| Immigrants | North Macedonia | 98.5 /100 | #95 | Exceptional 92.3% |
| Icelanders | 98.5 /100 | #96 | Exceptional 92.3% |
| Celtics | 98.4 /100 | #97 | Exceptional 92.3% |
| Immigrants | Kuwait | 98.4 /100 | #98 | Exceptional 92.3% |
| Immigrants | Korea | 98.3 /100 | #99 | Exceptional 92.3% |
| Immigrants | Croatia | 98.3 /100 | #100 | Exceptional 92.3% |
| Swiss | 98.1 /100 | #101 | Exceptional 92.3% |
| Alaskan Athabascans | 98.1 /100 | #102 | Exceptional 92.3% |
| Immigrants | Norway | 98.1 /100 | #103 | Exceptional 92.3% |
| Lebanese | 97.6 /100 | #104 | Exceptional 92.2% |
| Immigrants | Belarus | 97.4 /100 | #105 | Exceptional 92.2% |
| Immigrants | Russia | 97.3 /100 | #106 | Exceptional 92.2% |
| Syrians | 97.2 /100 | #107 | Exceptional 92.2% |
| Jordanians | 97.2 /100 | #108 | Exceptional 92.2% |
| Immigrants | Hungary | 97.0 /100 | #109 | Exceptional 92.1% |
| Palestinians | 97.0 /100 | #110 | Exceptional 92.1% |
| Immigrants | Greece | 96.9 /100 | #111 | Exceptional 92.1% |
| Israelis | 96.8 /100 | #112 | Exceptional 92.1% |
| Immigrants | Zimbabwe | 96.5 /100 | #113 | Exceptional 92.1% |
| Yugoslavians | 96.5 /100 | #114 | Exceptional 92.1% |
| Immigrants | Sri Lanka | 96.4 /100 | #115 | Exceptional 92.1% |