Hopi vs Immigrants from Eritrea Unemployment
COMPARE
Hopi
Immigrants from Eritrea
Unemployment
Unemployment Comparison
Hopi
Immigrants from Eritrea
8.9%
UNEMPLOYMENT
0.0/ 100
METRIC RATING
342nd/ 347
METRIC RANK
5.0%
UNEMPLOYMENT
93.3/ 100
METRIC RATING
109th/ 347
METRIC RANK
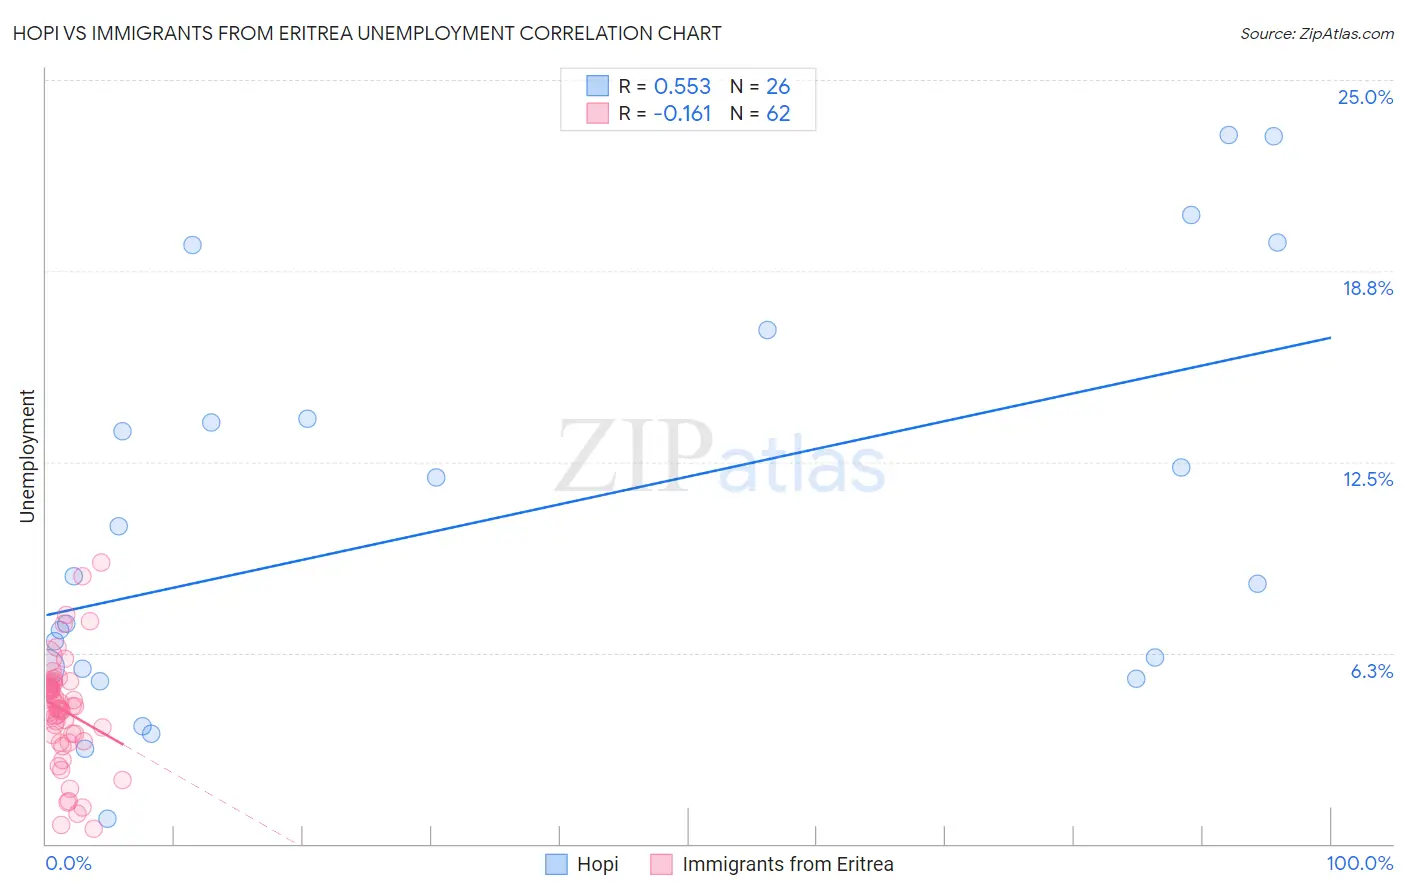
Hopi vs Immigrants from Eritrea Unemployment Correlation Chart
The statistical analysis conducted on geographies consisting of 74,716,849 people shows a substantial positive correlation between the proportion of Hopi and unemployment in the United States with a correlation coefficient (R) of 0.553 and weighted average of 8.9%. Similarly, the statistical analysis conducted on geographies consisting of 104,849,484 people shows a poor negative correlation between the proportion of Immigrants from Eritrea and unemployment in the United States with a correlation coefficient (R) of -0.161 and weighted average of 5.0%, a difference of 76.7%.
Unemployment Correlation Summary
| Measurement | Hopi | Immigrants from Eritrea |
| Minimum | 0.80% | 0.50% |
| Maximum | 23.2% | 9.2% |
| Range | 22.4% | 8.7% |
| Mean | 10.6% | 4.4% |
| Median | 8.6% | 4.5% |
| Interquartile 25% (IQ1) | 5.7% | 3.5% |
| Interquartile 75% (IQ3) | 13.9% | 5.2% |
| Interquartile Range (IQR) | 8.2% | 1.7% |
| Standard Deviation (Sample) | 6.5% | 1.8% |
| Standard Deviation (Population) | 6.4% | 1.7% |
Similar Demographics by Unemployment
Demographics Similar to Hopi by Unemployment
In terms of unemployment, the demographic groups most similar to Hopi are Tohono O'odham (8.9%, a difference of 0.45%), Yuman (9.1%, a difference of 1.7%), Puerto Rican (8.4%, a difference of 5.9%), Navajo (8.4%, a difference of 6.7%), and Pima (8.2%, a difference of 8.4%).
| Demographics | Rating | Rank | Unemployment |
| Immigrants | Dominican Republic | 0.0 /100 | #333 | Tragic 7.4% |
| Apache | 0.0 /100 | #334 | Tragic 7.4% |
| Alaskan Athabascans | 0.0 /100 | #335 | Tragic 7.7% |
| Immigrants | Yemen | 0.0 /100 | #336 | Tragic 7.7% |
| Cheyenne | 0.0 /100 | #337 | Tragic 8.0% |
| Pima | 0.0 /100 | #338 | Tragic 8.2% |
| Navajo | 0.0 /100 | #339 | Tragic 8.4% |
| Puerto Ricans | 0.0 /100 | #340 | Tragic 8.4% |
| Tohono O'odham | 0.0 /100 | #341 | Tragic 8.9% |
| Hopi | 0.0 /100 | #342 | Tragic 8.9% |
| Yuman | 0.0 /100 | #343 | Tragic 9.1% |
| Arapaho | 0.0 /100 | #344 | Tragic 9.8% |
| Inupiat | 0.0 /100 | #345 | Tragic 10.1% |
| Crow | 0.0 /100 | #346 | Tragic 11.1% |
| Yup'ik | 0.0 /100 | #347 | Tragic 13.6% |
Demographics Similar to Immigrants from Eritrea by Unemployment
In terms of unemployment, the demographic groups most similar to Immigrants from Eritrea are Immigrants from Lithuania (5.0%, a difference of 0.020%), Chilean (5.0%, a difference of 0.020%), Immigrants from Kuwait (5.0%, a difference of 0.10%), Immigrants from Turkey (5.0%, a difference of 0.11%), and Immigrants from Romania (5.0%, a difference of 0.12%).
| Demographics | Rating | Rank | Unemployment |
| Immigrants | Argentina | 94.1 /100 | #102 | Exceptional 5.0% |
| Chickasaw | 94.0 /100 | #103 | Exceptional 5.0% |
| Osage | 94.0 /100 | #104 | Exceptional 5.0% |
| Maltese | 94.0 /100 | #105 | Exceptional 5.0% |
| Immigrants | Romania | 93.7 /100 | #106 | Exceptional 5.0% |
| Immigrants | Turkey | 93.7 /100 | #107 | Exceptional 5.0% |
| Immigrants | Kuwait | 93.7 /100 | #108 | Exceptional 5.0% |
| Immigrants | Eritrea | 93.3 /100 | #109 | Exceptional 5.0% |
| Immigrants | Lithuania | 93.2 /100 | #110 | Exceptional 5.0% |
| Chileans | 93.2 /100 | #111 | Exceptional 5.0% |
| South Africans | 92.6 /100 | #112 | Exceptional 5.1% |
| Argentineans | 92.4 /100 | #113 | Exceptional 5.1% |
| Immigrants | Ireland | 92.1 /100 | #114 | Exceptional 5.1% |
| Immigrants | Western Europe | 91.1 /100 | #115 | Exceptional 5.1% |
| Immigrants | Sri Lanka | 91.1 /100 | #116 | Exceptional 5.1% |