Hmong vs Immigrants Unemployment Among Ages 65 to 74 years
COMPARE
Hmong
Immigrants
Unemployment Among Ages 65 to 74 years
Unemployment Among Ages 65 to 74 years Comparison
Hmong
Immigrants
4.2%
UNEMPLOYMENT AMONG AGES 65 TO 74 YEARS
100.0/ 100
METRIC RATING
1st/ 347
METRIC RANK
5.6%
UNEMPLOYMENT AMONG AGES 65 TO 74 YEARS
0.9/ 100
METRIC RATING
247th/ 347
METRIC RANK
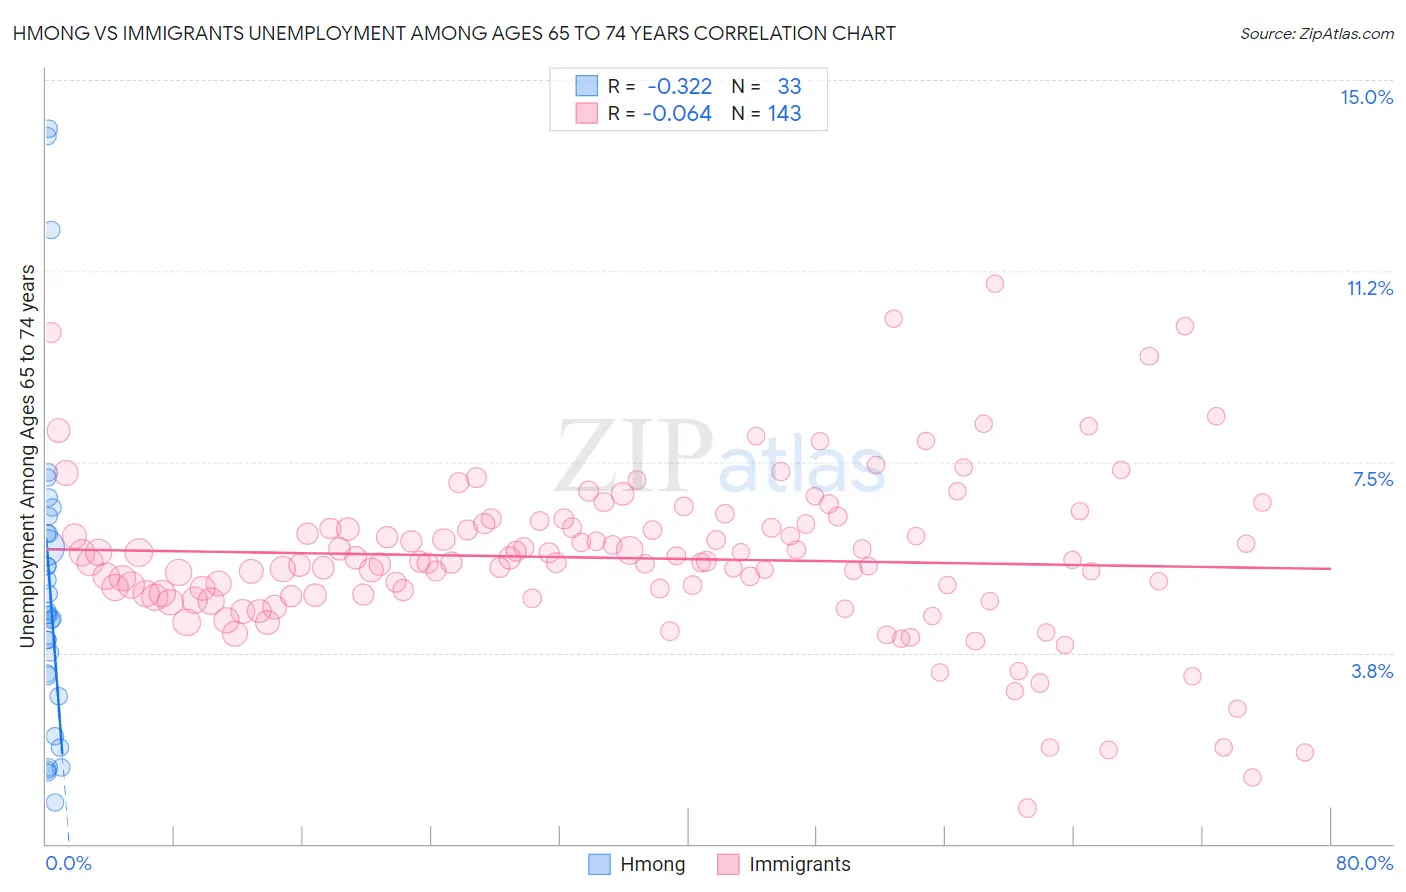
Hmong vs Immigrants Unemployment Among Ages 65 to 74 years Correlation Chart
The statistical analysis conducted on geographies consisting of 24,311,251 people shows a mild negative correlation between the proportion of Hmong and unemployment rate among population between the ages 65 and 74 in the United States with a correlation coefficient (R) of -0.322 and weighted average of 4.2%. Similarly, the statistical analysis conducted on geographies consisting of 448,278,971 people shows a slight negative correlation between the proportion of Immigrants and unemployment rate among population between the ages 65 and 74 in the United States with a correlation coefficient (R) of -0.064 and weighted average of 5.6%, a difference of 32.5%.
Unemployment Among Ages 65 to 74 years Correlation Summary
| Measurement | Hmong | Immigrants |
| Minimum | 0.80% | 0.70% |
| Maximum | 14.0% | 11.0% |
| Range | 13.2% | 10.3% |
| Mean | 5.1% | 5.6% |
| Median | 4.5% | 5.5% |
| Interquartile 25% (IQ1) | 3.1% | 4.9% |
| Interquartile 75% (IQ3) | 6.3% | 6.3% |
| Interquartile Range (IQR) | 3.2% | 1.4% |
| Standard Deviation (Sample) | 3.2% | 1.6% |
| Standard Deviation (Population) | 3.2% | 1.6% |
Similar Demographics by Unemployment Among Ages 65 to 74 years
Demographics Similar to Hmong by Unemployment Among Ages 65 to 74 years
In terms of unemployment among ages 65 to 74 years, the demographic groups most similar to Hmong are Chinese (4.4%, a difference of 5.7%), Fijian (4.5%, a difference of 7.3%), Tsimshian (4.6%, a difference of 8.9%), Sudanese (4.6%, a difference of 9.3%), and Immigrants from Cuba (4.6%, a difference of 9.9%).
| Demographics | Rating | Rank | Unemployment Among Ages 65 to 74 years |
| Hmong | 100.0 /100 | #1 | Exceptional 4.2% |
| Chinese | 100.0 /100 | #2 | Exceptional 4.4% |
| Fijians | 100.0 /100 | #3 | Exceptional 4.5% |
| Tsimshian | 100.0 /100 | #4 | Exceptional 4.6% |
| Sudanese | 100.0 /100 | #5 | Exceptional 4.6% |
| Immigrants | Cuba | 100.0 /100 | #6 | Exceptional 4.6% |
| Indonesians | 100.0 /100 | #7 | Exceptional 4.7% |
| Comanche | 100.0 /100 | #8 | Exceptional 4.7% |
| Chickasaw | 100.0 /100 | #9 | Exceptional 4.7% |
| Osage | 100.0 /100 | #10 | Exceptional 4.7% |
| Immigrants | Congo | 100.0 /100 | #11 | Exceptional 4.7% |
| Tongans | 100.0 /100 | #12 | Exceptional 4.7% |
| Lumbee | 100.0 /100 | #13 | Exceptional 4.8% |
| Cubans | 100.0 /100 | #14 | Exceptional 4.8% |
| Immigrants | North Macedonia | 100.0 /100 | #15 | Exceptional 4.8% |
Demographics Similar to Immigrants by Unemployment Among Ages 65 to 74 years
In terms of unemployment among ages 65 to 74 years, the demographic groups most similar to Immigrants are Immigrants from Argentina (5.6%, a difference of 0.0%), Paraguayan (5.6%, a difference of 0.050%), Immigrants from Micronesia (5.6%, a difference of 0.060%), Immigrants from Greece (5.6%, a difference of 0.060%), and Trinidadian and Tobagonian (5.6%, a difference of 0.060%).
| Demographics | Rating | Rank | Unemployment Among Ages 65 to 74 years |
| Ghanaians | 1.4 /100 | #240 | Tragic 5.6% |
| Cree | 1.4 /100 | #241 | Tragic 5.6% |
| Immigrants | Ghana | 1.4 /100 | #242 | Tragic 5.6% |
| Immigrants | Peru | 1.3 /100 | #243 | Tragic 5.6% |
| Immigrants | Micronesia | 0.9 /100 | #244 | Tragic 5.6% |
| Immigrants | Greece | 0.9 /100 | #245 | Tragic 5.6% |
| Paraguayans | 0.9 /100 | #246 | Tragic 5.6% |
| Immigrants | Immigrants | 0.9 /100 | #247 | Tragic 5.6% |
| Immigrants | Argentina | 0.9 /100 | #248 | Tragic 5.6% |
| Trinidadians and Tobagonians | 0.8 /100 | #249 | Tragic 5.6% |
| Cape Verdeans | 0.7 /100 | #250 | Tragic 5.6% |
| Brazilians | 0.5 /100 | #251 | Tragic 5.6% |
| Colombians | 0.5 /100 | #252 | Tragic 5.6% |
| Immigrants | Brazil | 0.5 /100 | #253 | Tragic 5.6% |
| Immigrants | Costa Rica | 0.5 /100 | #254 | Tragic 5.6% |