Haitian vs Finnish Unemployment Among Seniors over 65 years
COMPARE
Haitian
Finnish
Unemployment Among Seniors over 65 years
Unemployment Among Seniors over 65 years Comparison
Haitians
Finns
5.3%
UNEMPLOYMENT AMONG SENIORS OVER 65 YEARS
4.4/ 100
METRIC RATING
228th/ 347
METRIC RANK
5.0%
UNEMPLOYMENT AMONG SENIORS OVER 65 YEARS
92.2/ 100
METRIC RATING
111th/ 347
METRIC RANK
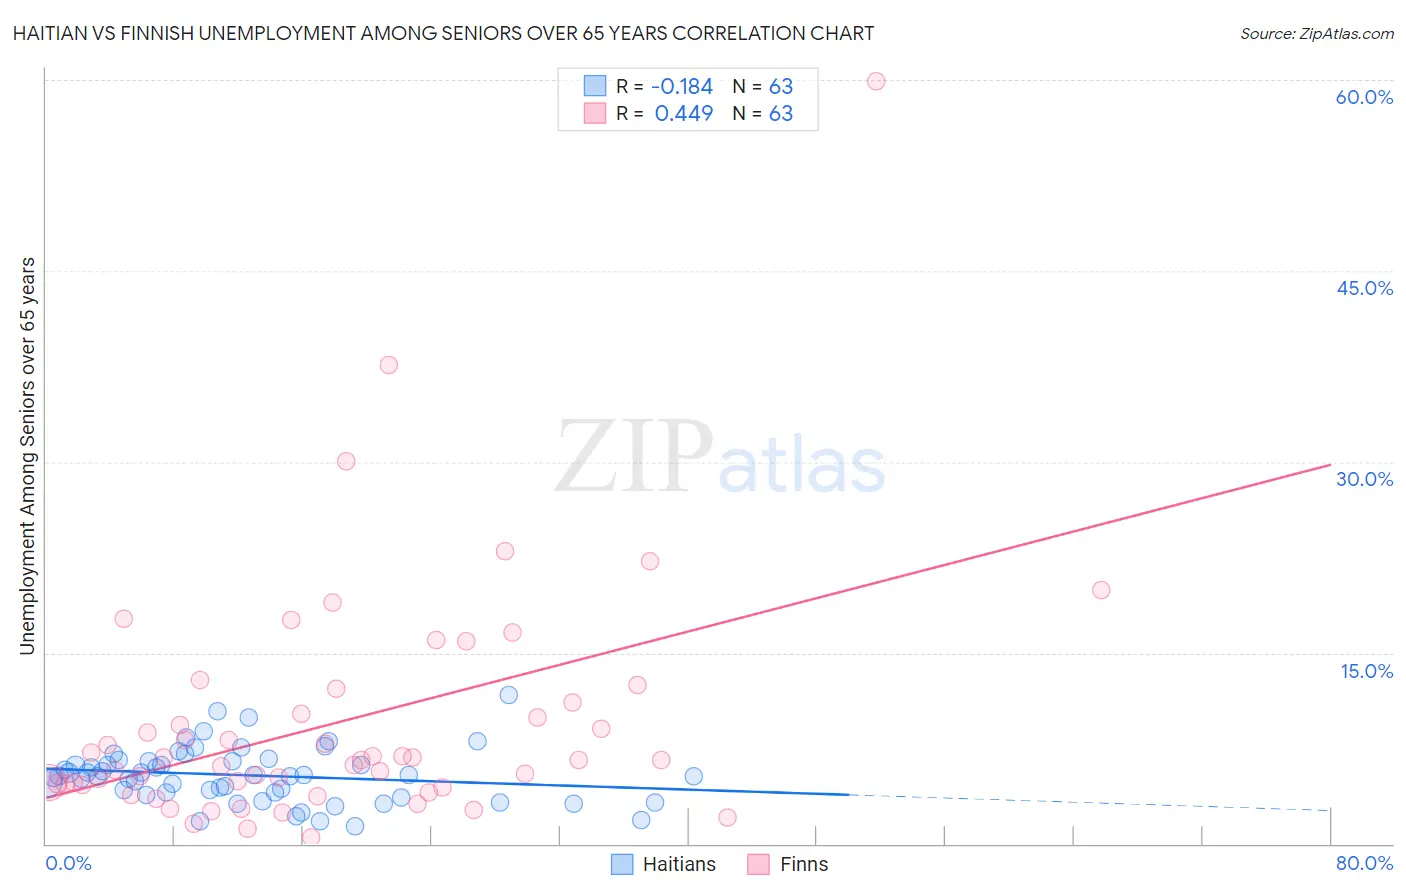
Haitian vs Finnish Unemployment Among Seniors over 65 years Correlation Chart
The statistical analysis conducted on geographies consisting of 266,373,920 people shows a poor negative correlation between the proportion of Haitians and unemployment rate amomg seniors over the age of 65 in the United States with a correlation coefficient (R) of -0.184 and weighted average of 5.3%. Similarly, the statistical analysis conducted on geographies consisting of 356,249,790 people shows a moderate positive correlation between the proportion of Finns and unemployment rate amomg seniors over the age of 65 in the United States with a correlation coefficient (R) of 0.449 and weighted average of 5.0%, a difference of 4.5%.
Unemployment Among Seniors over 65 years Correlation Summary
| Measurement | Haitian | Finnish |
| Minimum | 1.4% | 0.50% |
| Maximum | 11.7% | 59.9% |
| Range | 10.3% | 59.4% |
| Mean | 5.4% | 9.5% |
| Median | 5.3% | 6.6% |
| Interquartile 25% (IQ1) | 4.0% | 4.6% |
| Interquartile 75% (IQ3) | 6.5% | 11.1% |
| Interquartile Range (IQR) | 2.5% | 6.5% |
| Standard Deviation (Sample) | 2.1% | 9.5% |
| Standard Deviation (Population) | 2.1% | 9.5% |
Similar Demographics by Unemployment Among Seniors over 65 years
Demographics Similar to Haitians by Unemployment Among Seniors over 65 years
In terms of unemployment among seniors over 65 years, the demographic groups most similar to Haitians are Samoan (5.3%, a difference of 0.030%), Immigrants from Argentina (5.3%, a difference of 0.070%), Hungarian (5.3%, a difference of 0.10%), French American Indian (5.3%, a difference of 0.15%), and Immigrants from Croatia (5.3%, a difference of 0.16%).
| Demographics | Rating | Rank | Unemployment Among Seniors over 65 years |
| Arapaho | 6.3 /100 | #221 | Tragic 5.3% |
| Israelis | 6.2 /100 | #222 | Tragic 5.3% |
| Cree | 5.8 /100 | #223 | Tragic 5.3% |
| Immigrants | Syria | 5.6 /100 | #224 | Tragic 5.3% |
| Hondurans | 5.6 /100 | #225 | Tragic 5.3% |
| Immigrants | Croatia | 5.3 /100 | #226 | Tragic 5.3% |
| French American Indians | 5.2 /100 | #227 | Tragic 5.3% |
| Haitians | 4.4 /100 | #228 | Tragic 5.3% |
| Samoans | 4.2 /100 | #229 | Tragic 5.3% |
| Immigrants | Argentina | 4.0 /100 | #230 | Tragic 5.3% |
| Hungarians | 3.9 /100 | #231 | Tragic 5.3% |
| Hopi | 3.5 /100 | #232 | Tragic 5.3% |
| Marshallese | 3.1 /100 | #233 | Tragic 5.3% |
| Blackfeet | 3.1 /100 | #234 | Tragic 5.3% |
| Immigrants | Albania | 2.7 /100 | #235 | Tragic 5.3% |
Demographics Similar to Finns by Unemployment Among Seniors over 65 years
In terms of unemployment among seniors over 65 years, the demographic groups most similar to Finns are Eastern European (5.0%, a difference of 0.020%), Immigrants from Saudi Arabia (5.0%, a difference of 0.060%), Immigrants from Malaysia (5.0%, a difference of 0.070%), Seminole (5.0%, a difference of 0.080%), and Immigrants from Vietnam (5.0%, a difference of 0.090%).
| Demographics | Rating | Rank | Unemployment Among Seniors over 65 years |
| Immigrants | Scotland | 95.0 /100 | #104 | Exceptional 5.0% |
| Okinawans | 94.7 /100 | #105 | Exceptional 5.0% |
| Immigrants | Turkey | 94.3 /100 | #106 | Exceptional 5.0% |
| Immigrants | Germany | 93.2 /100 | #107 | Exceptional 5.0% |
| Immigrants | Vietnam | 92.9 /100 | #108 | Exceptional 5.0% |
| Immigrants | Malaysia | 92.7 /100 | #109 | Exceptional 5.0% |
| Immigrants | Saudi Arabia | 92.7 /100 | #110 | Exceptional 5.0% |
| Finns | 92.2 /100 | #111 | Exceptional 5.0% |
| Eastern Europeans | 92.0 /100 | #112 | Exceptional 5.0% |
| Seminole | 91.4 /100 | #113 | Exceptional 5.0% |
| Immigrants | Latvia | 91.4 /100 | #114 | Exceptional 5.0% |
| Celtics | 91.3 /100 | #115 | Exceptional 5.0% |
| Immigrants | Korea | 91.0 /100 | #116 | Exceptional 5.0% |
| Malaysians | 90.4 /100 | #117 | Exceptional 5.1% |
| Soviet Union | 90.1 /100 | #118 | Exceptional 5.1% |