Guatemalan vs Slavic Unemployment Among Ages 25 to 29 years
COMPARE
Guatemalan
Slavic
Unemployment Among Ages 25 to 29 years
Unemployment Among Ages 25 to 29 years Comparison
Guatemalans
Slavs
7.1%
UNEMPLOYMENT AMONG AGES 25 TO 29 YEARS
0.9/ 100
METRIC RATING
245th/ 347
METRIC RANK
6.5%
UNEMPLOYMENT AMONG AGES 25 TO 29 YEARS
72.5/ 100
METRIC RATING
142nd/ 347
METRIC RANK
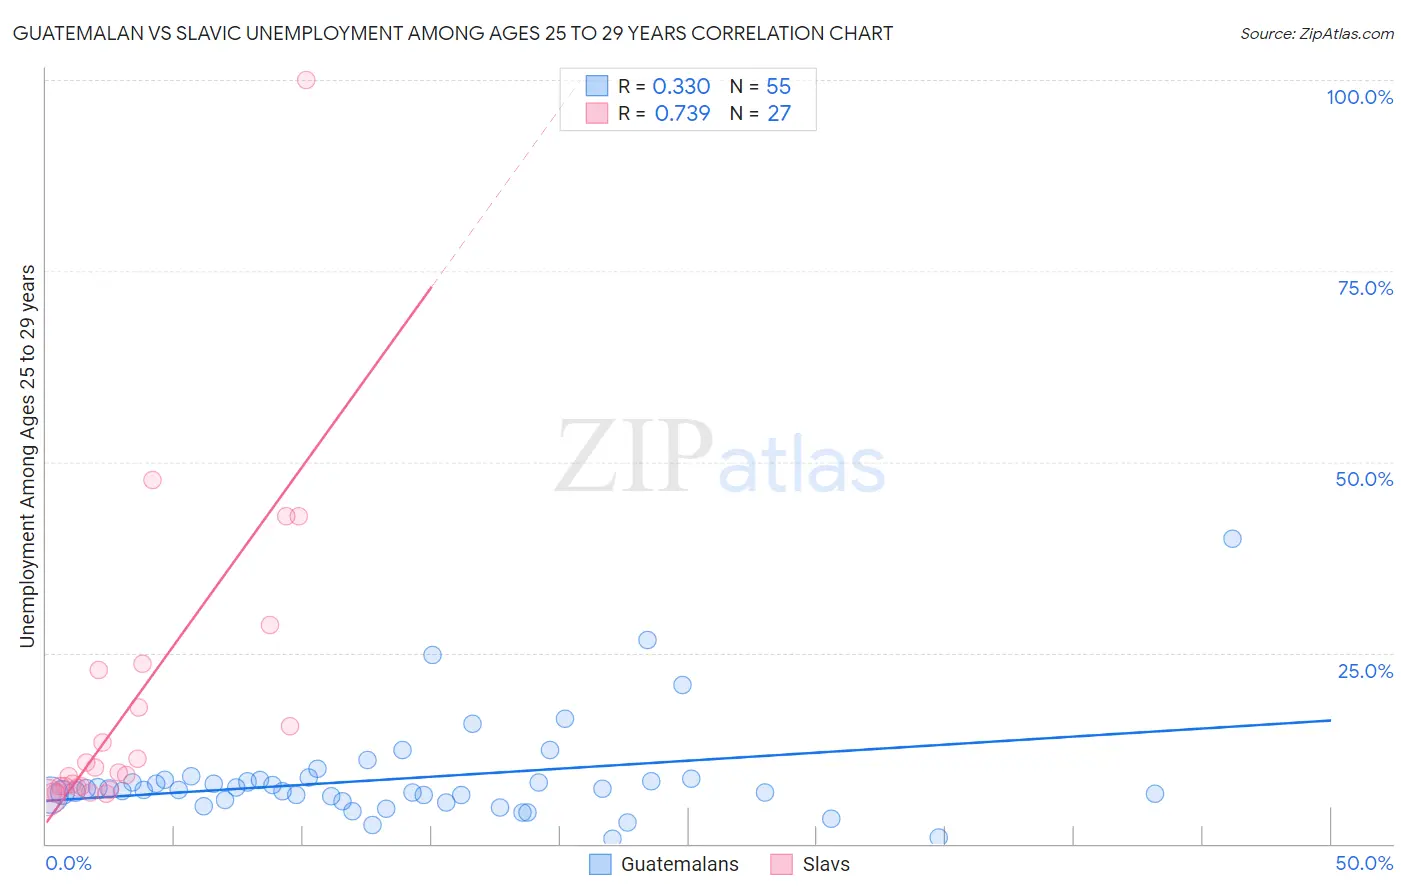
Guatemalan vs Slavic Unemployment Among Ages 25 to 29 years Correlation Chart
The statistical analysis conducted on geographies consisting of 390,290,903 people shows a mild positive correlation between the proportion of Guatemalans and unemployment rate among population between the ages 25 and 29 in the United States with a correlation coefficient (R) of 0.330 and weighted average of 7.1%. Similarly, the statistical analysis conducted on geographies consisting of 259,335,630 people shows a strong positive correlation between the proportion of Slavs and unemployment rate among population between the ages 25 and 29 in the United States with a correlation coefficient (R) of 0.739 and weighted average of 6.5%, a difference of 8.9%.
Unemployment Among Ages 25 to 29 years Correlation Summary
| Measurement | Guatemalan | Slavic |
| Minimum | 0.70% | 6.1% |
| Maximum | 40.0% | 100.0% |
| Range | 39.3% | 93.9% |
| Mean | 8.6% | 18.2% |
| Median | 7.1% | 9.4% |
| Interquartile 25% (IQ1) | 5.7% | 7.4% |
| Interquartile 75% (IQ3) | 8.4% | 22.8% |
| Interquartile Range (IQR) | 2.7% | 15.4% |
| Standard Deviation (Sample) | 6.5% | 20.3% |
| Standard Deviation (Population) | 6.4% | 20.0% |
Similar Demographics by Unemployment Among Ages 25 to 29 years
Demographics Similar to Guatemalans by Unemployment Among Ages 25 to 29 years
In terms of unemployment among ages 25 to 29 years, the demographic groups most similar to Guatemalans are Nonimmigrants (7.1%, a difference of 0.10%), Yaqui (7.1%, a difference of 0.13%), Spanish American Indian (7.1%, a difference of 0.26%), Immigrants from Uzbekistan (7.2%, a difference of 0.40%), and Immigrants from Guatemala (7.2%, a difference of 0.41%).
| Demographics | Rating | Rank | Unemployment Among Ages 25 to 29 years |
| Hondurans | 1.8 /100 | #238 | Tragic 7.1% |
| Potawatomi | 1.3 /100 | #239 | Tragic 7.1% |
| Native Hawaiians | 1.3 /100 | #240 | Tragic 7.1% |
| Immigrants | Sierra Leone | 1.3 /100 | #241 | Tragic 7.1% |
| Spanish American Indians | 1.1 /100 | #242 | Tragic 7.1% |
| Yaqui | 1.0 /100 | #243 | Tragic 7.1% |
| Immigrants | Nonimmigrants | 0.9 /100 | #244 | Tragic 7.1% |
| Guatemalans | 0.9 /100 | #245 | Tragic 7.1% |
| Immigrants | Uzbekistan | 0.7 /100 | #246 | Tragic 7.2% |
| Immigrants | Guatemala | 0.7 /100 | #247 | Tragic 7.2% |
| Sub-Saharan Africans | 0.6 /100 | #248 | Tragic 7.2% |
| Seminole | 0.6 /100 | #249 | Tragic 7.2% |
| Delaware | 0.5 /100 | #250 | Tragic 7.2% |
| Portuguese | 0.5 /100 | #251 | Tragic 7.2% |
| Sierra Leoneans | 0.4 /100 | #252 | Tragic 7.2% |
Demographics Similar to Slavs by Unemployment Among Ages 25 to 29 years
In terms of unemployment among ages 25 to 29 years, the demographic groups most similar to Slavs are Lithuanian (6.5%, a difference of 0.020%), Maltese (6.5%, a difference of 0.030%), Immigrants from Micronesia (6.6%, a difference of 0.080%), Immigrants from Belgium (6.5%, a difference of 0.10%), and Austrian (6.5%, a difference of 0.10%).
| Demographics | Rating | Rank | Unemployment Among Ages 25 to 29 years |
| Immigrants | Croatia | 75.5 /100 | #135 | Good 6.5% |
| Northern Europeans | 75.4 /100 | #136 | Good 6.5% |
| Eastern Europeans | 74.1 /100 | #137 | Good 6.5% |
| Immigrants | Belgium | 73.8 /100 | #138 | Good 6.5% |
| Austrians | 73.8 /100 | #139 | Good 6.5% |
| Immigrants | Pakistan | 73.8 /100 | #140 | Good 6.5% |
| Maltese | 72.9 /100 | #141 | Good 6.5% |
| Slavs | 72.5 /100 | #142 | Good 6.5% |
| Lithuanians | 72.2 /100 | #143 | Good 6.5% |
| Immigrants | Micronesia | 71.5 /100 | #144 | Good 6.6% |
| Nicaraguans | 70.2 /100 | #145 | Good 6.6% |
| Romanians | 69.5 /100 | #146 | Good 6.6% |
| Immigrants | Thailand | 68.4 /100 | #147 | Good 6.6% |
| Peruvians | 68.1 /100 | #148 | Good 6.6% |
| Malaysians | 67.1 /100 | #149 | Good 6.6% |