Guamanian/Chamorro vs Immigrants from Panama Unemployment Among Ages 35 to 44 years
COMPARE
Guamanian/Chamorro
Immigrants from Panama
Unemployment Among Ages 35 to 44 years
Unemployment Among Ages 35 to 44 years Comparison
Guamanians/Chamorros
Immigrants from Panama
5.1%
UNEMPLOYMENT AMONG AGES 35 TO 44 YEARS
0.9/ 100
METRIC RATING
235th/ 347
METRIC RANK
5.0%
UNEMPLOYMENT AMONG AGES 35 TO 44 YEARS
3.3/ 100
METRIC RATING
223rd/ 347
METRIC RANK
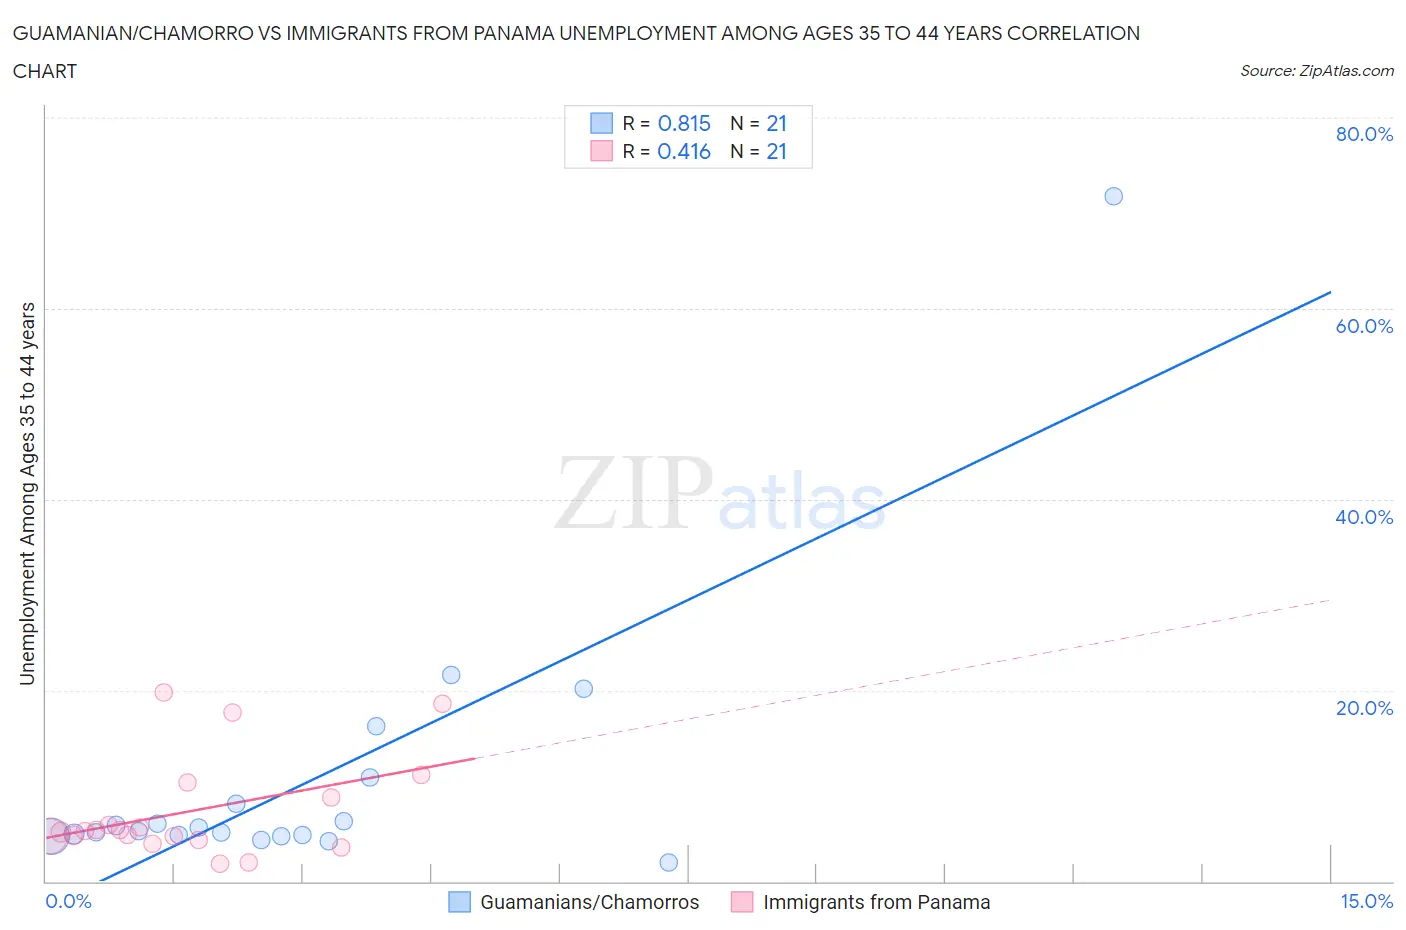
Guamanian/Chamorro vs Immigrants from Panama Unemployment Among Ages 35 to 44 years Correlation Chart
The statistical analysis conducted on geographies consisting of 219,585,271 people shows a very strong positive correlation between the proportion of Guamanians/Chamorros and unemployment rate among population between the ages 35 and 44 in the United States with a correlation coefficient (R) of 0.815 and weighted average of 5.1%. Similarly, the statistical analysis conducted on geographies consisting of 219,440,273 people shows a moderate positive correlation between the proportion of Immigrants from Panama and unemployment rate among population between the ages 35 and 44 in the United States with a correlation coefficient (R) of 0.416 and weighted average of 5.0%, a difference of 2.1%.
Unemployment Among Ages 35 to 44 years Correlation Summary
| Measurement | Guamanian/Chamorro | Immigrants from Panama |
| Minimum | 1.9% | 1.9% |
| Maximum | 71.7% | 19.8% |
| Range | 69.8% | 17.9% |
| Mean | 10.6% | 7.3% |
| Median | 5.2% | 5.2% |
| Interquartile 25% (IQ1) | 4.8% | 4.5% |
| Interquartile 75% (IQ3) | 9.5% | 9.6% |
| Interquartile Range (IQR) | 4.7% | 5.1% |
| Standard Deviation (Sample) | 15.0% | 5.3% |
| Standard Deviation (Population) | 14.6% | 5.1% |
Demographics Similar to Guamanians/Chamorros and Immigrants from Panama by Unemployment Among Ages 35 to 44 years
In terms of unemployment among ages 35 to 44 years, the demographic groups most similar to Guamanians/Chamorros are Central American (5.1%, a difference of 0.21%), Portuguese (5.1%, a difference of 0.26%), Kiowa (5.1%, a difference of 0.26%), Immigrants from Nigeria (5.1%, a difference of 0.33%), and Iroquois (5.1%, a difference of 0.38%). Similarly, the demographic groups most similar to Immigrants from Panama are Hmong (5.0%, a difference of 0.080%), Panamanian (5.0%, a difference of 0.23%), Bermudan (5.0%, a difference of 0.27%), Immigrants from Lebanon (5.0%, a difference of 0.35%), and Potawatomi (5.0%, a difference of 0.46%).
| Demographics | Rating | Rank | Unemployment Among Ages 35 to 44 years |
| Sierra Leoneans | 4.8 /100 | #219 | Tragic 4.9% |
| Immigrants | Sierra Leone | 4.7 /100 | #220 | Tragic 4.9% |
| Bermudans | 3.9 /100 | #221 | Tragic 5.0% |
| Hmong | 3.5 /100 | #222 | Tragic 5.0% |
| Immigrants | Panama | 3.3 /100 | #223 | Tragic 5.0% |
| Panamanians | 2.9 /100 | #224 | Tragic 5.0% |
| Immigrants | Lebanon | 2.7 /100 | #225 | Tragic 5.0% |
| Potawatomi | 2.5 /100 | #226 | Tragic 5.0% |
| Immigrants | Uzbekistan | 1.9 /100 | #227 | Tragic 5.0% |
| Samoans | 1.8 /100 | #228 | Tragic 5.0% |
| Immigrants | Cambodia | 1.5 /100 | #229 | Tragic 5.0% |
| Liberians | 1.3 /100 | #230 | Tragic 5.1% |
| Japanese | 1.2 /100 | #231 | Tragic 5.1% |
| Iroquois | 1.2 /100 | #232 | Tragic 5.1% |
| Immigrants | Nigeria | 1.2 /100 | #233 | Tragic 5.1% |
| Portuguese | 1.1 /100 | #234 | Tragic 5.1% |
| Guamanians/Chamorros | 0.9 /100 | #235 | Tragic 5.1% |
| Central Americans | 0.8 /100 | #236 | Tragic 5.1% |
| Kiowa | 0.8 /100 | #237 | Tragic 5.1% |
| Hondurans | 0.7 /100 | #238 | Tragic 5.1% |
| Nigerians | 0.7 /100 | #239 | Tragic 5.1% |