Guamanian/Chamorro vs Cherokee Unemployment Among Ages 35 to 44 years
COMPARE
Guamanian/Chamorro
Cherokee
Unemployment Among Ages 35 to 44 years
Unemployment Among Ages 35 to 44 years Comparison
Guamanians/Chamorros
Cherokee
5.1%
UNEMPLOYMENT AMONG AGES 35 TO 44 YEARS
0.9/ 100
METRIC RATING
235th/ 347
METRIC RANK
5.2%
UNEMPLOYMENT AMONG AGES 35 TO 44 YEARS
0.2/ 100
METRIC RATING
255th/ 347
METRIC RANK
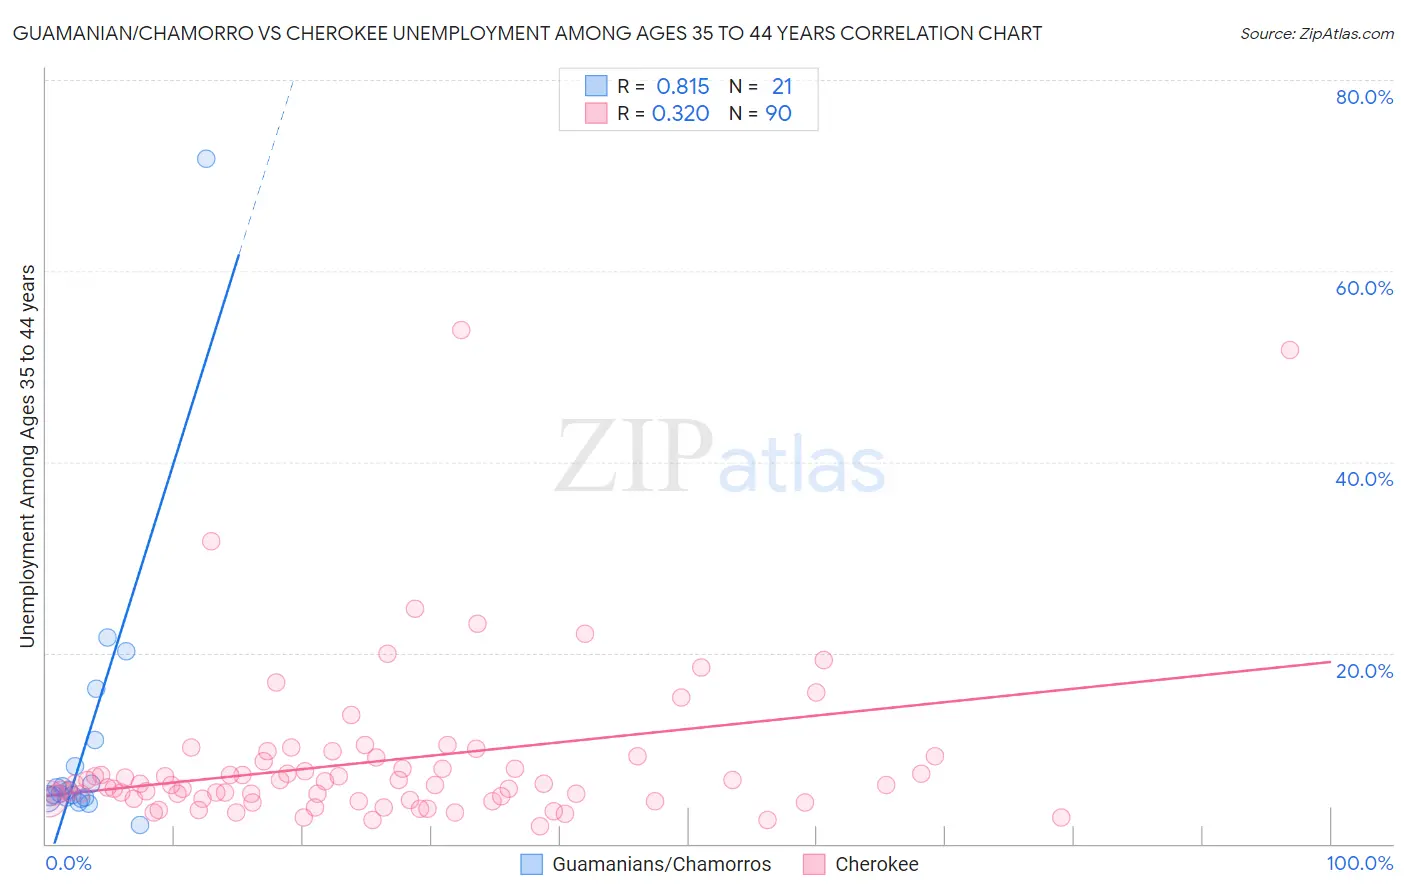
Guamanian/Chamorro vs Cherokee Unemployment Among Ages 35 to 44 years Correlation Chart
The statistical analysis conducted on geographies consisting of 219,585,271 people shows a very strong positive correlation between the proportion of Guamanians/Chamorros and unemployment rate among population between the ages 35 and 44 in the United States with a correlation coefficient (R) of 0.815 and weighted average of 5.1%. Similarly, the statistical analysis conducted on geographies consisting of 472,158,957 people shows a mild positive correlation between the proportion of Cherokee and unemployment rate among population between the ages 35 and 44 in the United States with a correlation coefficient (R) of 0.320 and weighted average of 5.2%, a difference of 3.0%.
Unemployment Among Ages 35 to 44 years Correlation Summary
| Measurement | Guamanian/Chamorro | Cherokee |
| Minimum | 1.9% | 1.8% |
| Maximum | 71.7% | 53.8% |
| Range | 69.8% | 52.0% |
| Mean | 10.6% | 8.7% |
| Median | 5.2% | 6.2% |
| Interquartile 25% (IQ1) | 4.8% | 4.7% |
| Interquartile 75% (IQ3) | 9.5% | 9.0% |
| Interquartile Range (IQR) | 4.7% | 4.3% |
| Standard Deviation (Sample) | 15.0% | 8.5% |
| Standard Deviation (Population) | 14.6% | 8.5% |
Demographics Similar to Guamanians/Chamorros and Cherokee by Unemployment Among Ages 35 to 44 years
In terms of unemployment among ages 35 to 44 years, the demographic groups most similar to Guamanians/Chamorros are Central American (5.1%, a difference of 0.21%), Kiowa (5.1%, a difference of 0.26%), Honduran (5.1%, a difference of 0.42%), Nigerian (5.1%, a difference of 0.49%), and Somali (5.1%, a difference of 0.61%). Similarly, the demographic groups most similar to Cherokee are Immigrants from Bahamas (5.2%, a difference of 0.050%), Mexican American Indian (5.2%, a difference of 0.080%), Armenian (5.2%, a difference of 0.10%), Comanche (5.2%, a difference of 0.23%), and Immigrants from El Salvador (5.2%, a difference of 0.67%).
| Demographics | Rating | Rank | Unemployment Among Ages 35 to 44 years |
| Guamanians/Chamorros | 0.9 /100 | #235 | Tragic 5.1% |
| Central Americans | 0.8 /100 | #236 | Tragic 5.1% |
| Kiowa | 0.8 /100 | #237 | Tragic 5.1% |
| Hondurans | 0.7 /100 | #238 | Tragic 5.1% |
| Nigerians | 0.7 /100 | #239 | Tragic 5.1% |
| Somalis | 0.7 /100 | #240 | Tragic 5.1% |
| Immigrants | Honduras | 0.6 /100 | #241 | Tragic 5.1% |
| Delaware | 0.5 /100 | #242 | Tragic 5.1% |
| Salvadorans | 0.4 /100 | #243 | Tragic 5.1% |
| Guatemalans | 0.4 /100 | #244 | Tragic 5.1% |
| Bahamians | 0.4 /100 | #245 | Tragic 5.2% |
| Immigrants | Guatemala | 0.4 /100 | #246 | Tragic 5.2% |
| Immigrants | Somalia | 0.3 /100 | #247 | Tragic 5.2% |
| Alsatians | 0.2 /100 | #248 | Tragic 5.2% |
| Immigrants | Liberia | 0.2 /100 | #249 | Tragic 5.2% |
| Immigrants | El Salvador | 0.2 /100 | #250 | Tragic 5.2% |
| Comanche | 0.2 /100 | #251 | Tragic 5.2% |
| Armenians | 0.2 /100 | #252 | Tragic 5.2% |
| Mexican American Indians | 0.2 /100 | #253 | Tragic 5.2% |
| Immigrants | Bahamas | 0.2 /100 | #254 | Tragic 5.2% |
| Cherokee | 0.2 /100 | #255 | Tragic 5.2% |