Greek vs Tongan Unemployment Among Women with Children Ages 6 to 17 years
COMPARE
Greek
Tongan
Unemployment Among Women with Children Ages 6 to 17 years
Unemployment Among Women with Children Ages 6 to 17 years Comparison
Greeks
Tongans
8.9%
UNEMPLOYMENT AMONG WOMEN WITH CHILDREN AGES 6 TO 17 YEARS
75.2/ 100
METRIC RATING
150th/ 347
METRIC RANK
6.7%
UNEMPLOYMENT AMONG WOMEN WITH CHILDREN AGES 6 TO 17 YEARS
100.0/ 100
METRIC RATING
3rd/ 347
METRIC RANK
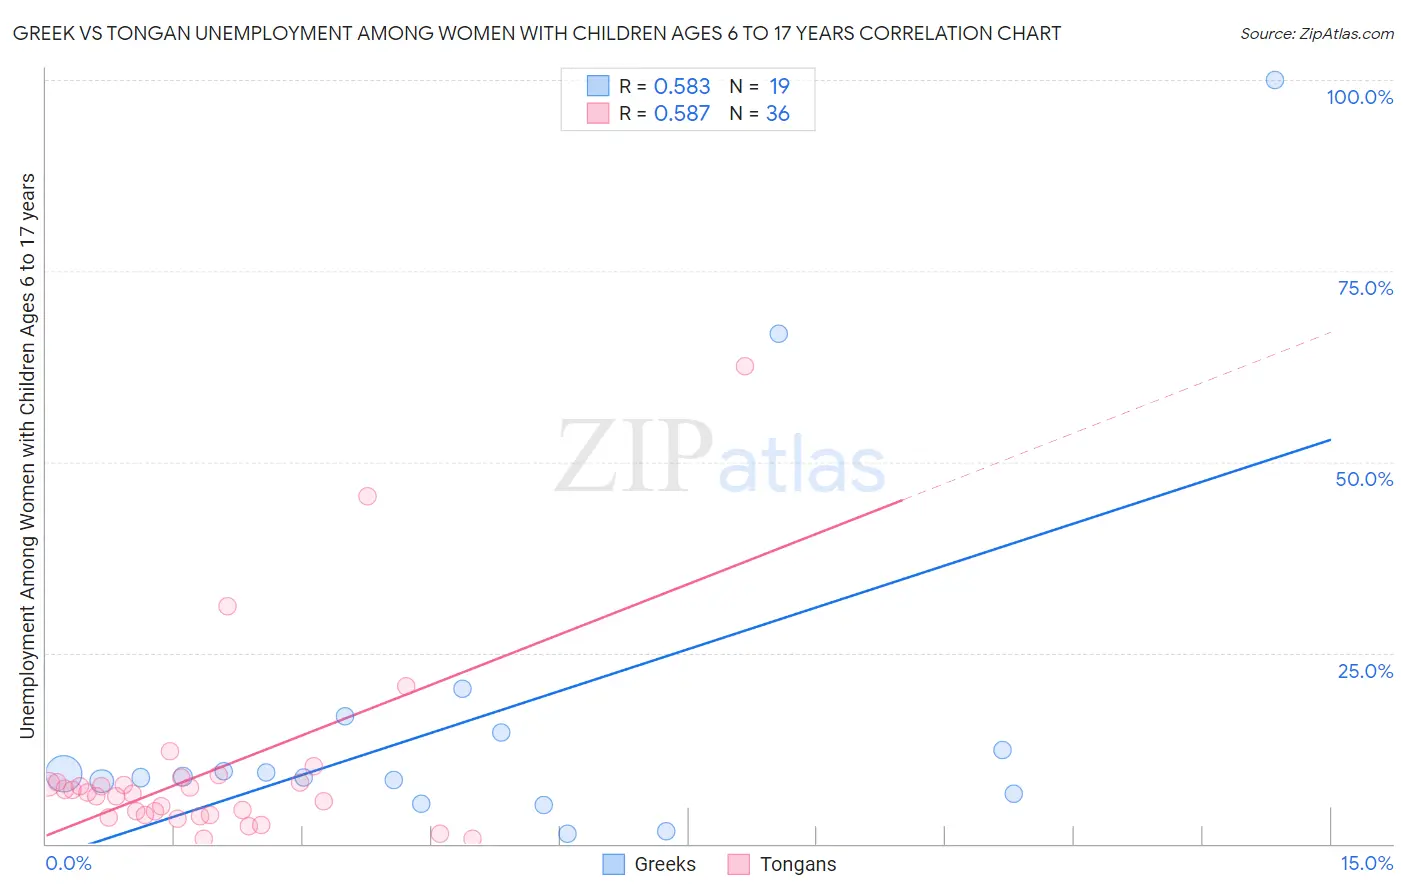
Greek vs Tongan Unemployment Among Women with Children Ages 6 to 17 years Correlation Chart
The statistical analysis conducted on geographies consisting of 323,893,189 people shows a substantial positive correlation between the proportion of Greeks and unemployment rate among women with children between the ages 6 and 17 in the United States with a correlation coefficient (R) of 0.583 and weighted average of 8.9%. Similarly, the statistical analysis conducted on geographies consisting of 89,455,021 people shows a substantial positive correlation between the proportion of Tongans and unemployment rate among women with children between the ages 6 and 17 in the United States with a correlation coefficient (R) of 0.587 and weighted average of 6.7%, a difference of 32.0%.
Unemployment Among Women with Children Ages 6 to 17 years Correlation Summary
| Measurement | Greek | Tongan |
| Minimum | 1.3% | 0.60% |
| Maximum | 100.0% | 62.5% |
| Range | 98.7% | 61.9% |
| Mean | 16.9% | 9.5% |
| Median | 8.8% | 6.7% |
| Interquartile 25% (IQ1) | 6.5% | 3.8% |
| Interquartile 75% (IQ3) | 14.6% | 8.1% |
| Interquartile Range (IQR) | 8.1% | 4.3% |
| Standard Deviation (Sample) | 24.5% | 12.4% |
| Standard Deviation (Population) | 23.8% | 12.2% |
Similar Demographics by Unemployment Among Women with Children Ages 6 to 17 years
Demographics Similar to Greeks by Unemployment Among Women with Children Ages 6 to 17 years
In terms of unemployment among women with children ages 6 to 17 years, the demographic groups most similar to Greeks are Immigrants from Eastern Africa (8.9%, a difference of 0.040%), Immigrants from Northern Europe (8.9%, a difference of 0.040%), Croatian (8.8%, a difference of 0.050%), Costa Rican (8.8%, a difference of 0.11%), and Immigrants from Europe (8.9%, a difference of 0.11%).
| Demographics | Rating | Rank | Unemployment Among Women with Children Ages 6 to 17 years |
| Immigrants | Kenya | 86.1 /100 | #143 | Excellent 8.8% |
| Russians | 85.8 /100 | #144 | Excellent 8.8% |
| Kenyans | 85.6 /100 | #145 | Excellent 8.8% |
| Chileans | 80.8 /100 | #146 | Excellent 8.8% |
| Immigrants | Bangladesh | 79.4 /100 | #147 | Good 8.8% |
| Costa Ricans | 77.0 /100 | #148 | Good 8.8% |
| Croatians | 76.0 /100 | #149 | Good 8.8% |
| Greeks | 75.2 /100 | #150 | Good 8.9% |
| Immigrants | Eastern Africa | 74.6 /100 | #151 | Good 8.9% |
| Immigrants | Northern Europe | 74.6 /100 | #152 | Good 8.9% |
| Immigrants | Europe | 73.4 /100 | #153 | Good 8.9% |
| Vietnamese | 72.1 /100 | #154 | Good 8.9% |
| Immigrants | Greece | 71.8 /100 | #155 | Good 8.9% |
| Osage | 65.9 /100 | #156 | Good 8.9% |
| Immigrants | Belgium | 65.6 /100 | #157 | Good 8.9% |
Demographics Similar to Tongans by Unemployment Among Women with Children Ages 6 to 17 years
In terms of unemployment among women with children ages 6 to 17 years, the demographic groups most similar to Tongans are Fijian (6.6%, a difference of 1.2%), Taiwanese (6.5%, a difference of 3.8%), Ute (7.0%, a difference of 4.5%), Okinawan (7.0%, a difference of 5.1%), and Tlingit-Haida (7.1%, a difference of 5.6%).
| Demographics | Rating | Rank | Unemployment Among Women with Children Ages 6 to 17 years |
| Taiwanese | 100.0 /100 | #1 | Exceptional 6.5% |
| Fijians | 100.0 /100 | #2 | Exceptional 6.6% |
| Tongans | 100.0 /100 | #3 | Exceptional 6.7% |
| Ute | 100.0 /100 | #4 | Exceptional 7.0% |
| Okinawans | 100.0 /100 | #5 | Exceptional 7.0% |
| Tlingit-Haida | 100.0 /100 | #6 | Exceptional 7.1% |
| Soviet Union | 100.0 /100 | #7 | Exceptional 7.1% |
| Immigrants | Hong Kong | 100.0 /100 | #8 | Exceptional 7.2% |
| Assyrians/Chaldeans/Syriacs | 100.0 /100 | #9 | Exceptional 7.2% |
| Immigrants | Fiji | 100.0 /100 | #10 | Exceptional 7.3% |
| Immigrants | Taiwan | 100.0 /100 | #11 | Exceptional 7.3% |
| Bangladeshis | 100.0 /100 | #12 | Exceptional 7.4% |
| Indonesians | 100.0 /100 | #13 | Exceptional 7.4% |
| Sudanese | 100.0 /100 | #14 | Exceptional 7.4% |
| Puget Sound Salish | 100.0 /100 | #15 | Exceptional 7.5% |