Greek vs Polish Unemployment Among Youth under 25 years
COMPARE
Greek
Polish
Unemployment Among Youth under 25 years
Unemployment Among Youth under 25 years Comparison
Greeks
Poles
11.4%
UNEMPLOYMENT AMONG YOUTH UNDER 25 YEARS
86.2/ 100
METRIC RATING
127th/ 347
METRIC RANK
11.0%
UNEMPLOYMENT AMONG YOUTH UNDER 25 YEARS
99.3/ 100
METRIC RATING
48th/ 347
METRIC RANK
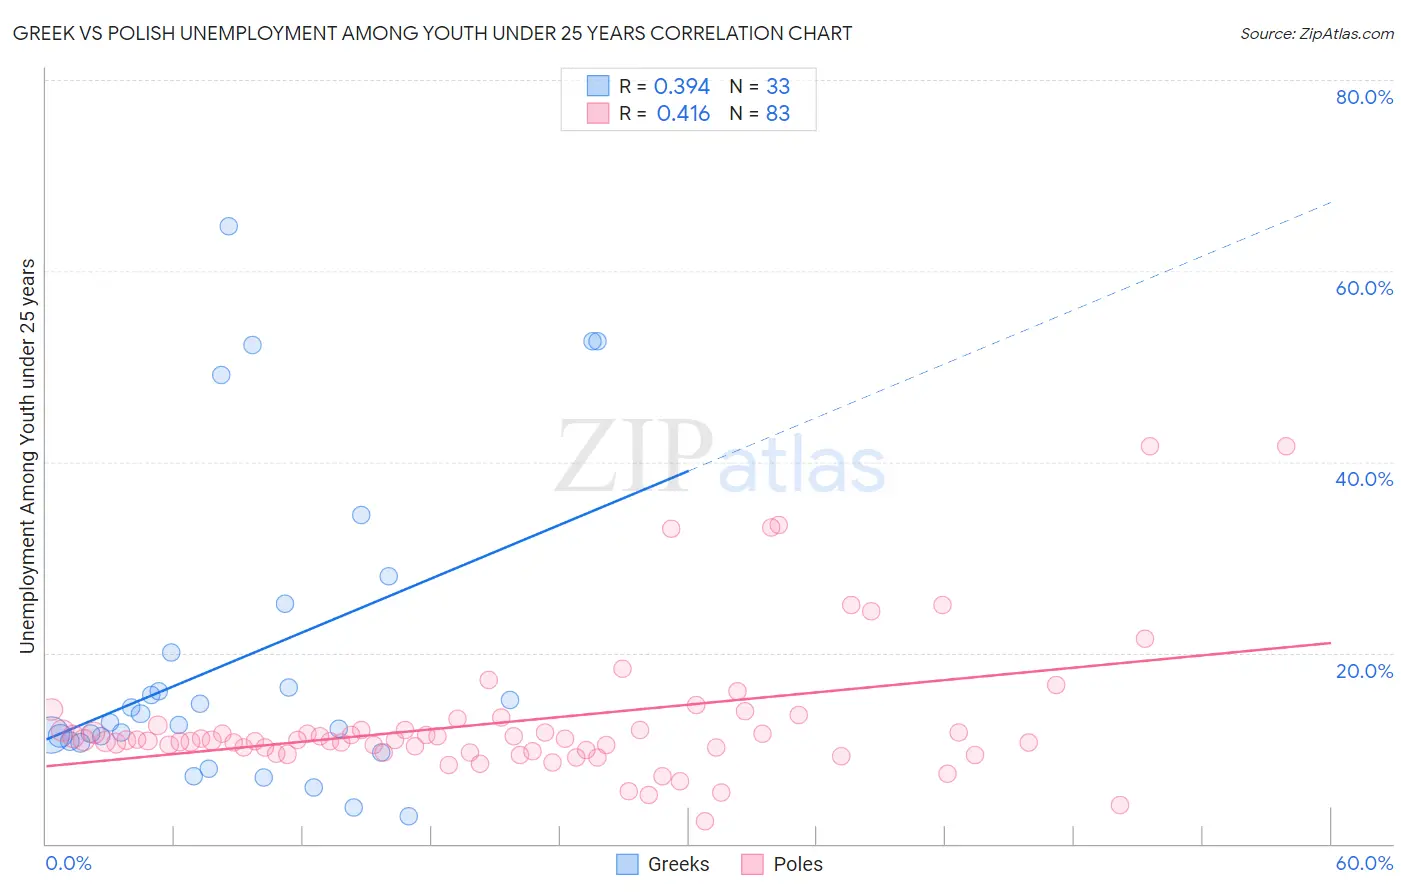
Greek vs Polish Unemployment Among Youth under 25 years Correlation Chart
The statistical analysis conducted on geographies consisting of 472,341,363 people shows a mild positive correlation between the proportion of Greeks and unemployment rate among youth under the age of 25 in the United States with a correlation coefficient (R) of 0.394 and weighted average of 11.4%. Similarly, the statistical analysis conducted on geographies consisting of 537,929,649 people shows a moderate positive correlation between the proportion of Poles and unemployment rate among youth under the age of 25 in the United States with a correlation coefficient (R) of 0.416 and weighted average of 11.0%, a difference of 3.5%.
Unemployment Among Youth under 25 years Correlation Summary
| Measurement | Greek | Polish |
| Minimum | 2.9% | 2.4% |
| Maximum | 64.6% | 41.6% |
| Range | 61.7% | 39.2% |
| Mean | 19.5% | 12.8% |
| Median | 12.7% | 10.8% |
| Interquartile 25% (IQ1) | 10.7% | 9.7% |
| Interquartile 75% (IQ3) | 22.6% | 12.0% |
| Interquartile Range (IQR) | 11.9% | 2.3% |
| Standard Deviation (Sample) | 16.3% | 7.2% |
| Standard Deviation (Population) | 16.1% | 7.2% |
Similar Demographics by Unemployment Among Youth under 25 years
Demographics Similar to Greeks by Unemployment Among Youth under 25 years
In terms of unemployment among youth under 25 years, the demographic groups most similar to Greeks are Immigrants from Hungary (11.4%, a difference of 0.020%), Turkish (11.4%, a difference of 0.030%), Canadian (11.4%, a difference of 0.040%), Hungarian (11.4%, a difference of 0.050%), and Italian (11.4%, a difference of 0.090%).
| Demographics | Rating | Rank | Unemployment Among Youth under 25 years |
| Malaysians | 89.0 /100 | #120 | Excellent 11.4% |
| Slovaks | 88.9 /100 | #121 | Excellent 11.4% |
| Immigrants | Micronesia | 88.1 /100 | #122 | Excellent 11.4% |
| Basques | 87.8 /100 | #123 | Excellent 11.4% |
| Italians | 87.2 /100 | #124 | Excellent 11.4% |
| Immigrants | Argentina | 87.2 /100 | #125 | Excellent 11.4% |
| Canadians | 86.6 /100 | #126 | Excellent 11.4% |
| Greeks | 86.2 /100 | #127 | Excellent 11.4% |
| Immigrants | Hungary | 86.0 /100 | #128 | Excellent 11.4% |
| Turks | 85.8 /100 | #129 | Excellent 11.4% |
| Hungarians | 85.7 /100 | #130 | Excellent 11.4% |
| Immigrants | Spain | 84.6 /100 | #131 | Excellent 11.4% |
| Ethiopians | 83.2 /100 | #132 | Excellent 11.4% |
| Lebanese | 83.1 /100 | #133 | Excellent 11.4% |
| Immigrants | Chile | 80.4 /100 | #134 | Excellent 11.4% |
Demographics Similar to Poles by Unemployment Among Youth under 25 years
In terms of unemployment among youth under 25 years, the demographic groups most similar to Poles are Thai (11.0%, a difference of 0.070%), Czechoslovakian (11.0%, a difference of 0.17%), Serbian (11.0%, a difference of 0.40%), Latvian (11.0%, a difference of 0.42%), and Ottawa (11.1%, a difference of 0.50%).
| Demographics | Rating | Rank | Unemployment Among Youth under 25 years |
| Croatians | 99.8 /100 | #41 | Exceptional 10.9% |
| Cambodians | 99.7 /100 | #42 | Exceptional 10.9% |
| British | 99.7 /100 | #43 | Exceptional 10.9% |
| Welsh | 99.7 /100 | #44 | Exceptional 10.9% |
| Bulgarians | 99.6 /100 | #45 | Exceptional 10.9% |
| Tongans | 99.6 /100 | #46 | Exceptional 10.9% |
| Australians | 99.6 /100 | #47 | Exceptional 10.9% |
| Poles | 99.3 /100 | #48 | Exceptional 11.0% |
| Thais | 99.3 /100 | #49 | Exceptional 11.0% |
| Czechoslovakians | 99.2 /100 | #50 | Exceptional 11.0% |
| Serbians | 99.0 /100 | #51 | Exceptional 11.0% |
| Latvians | 99.0 /100 | #52 | Exceptional 11.0% |
| Ottawa | 99.0 /100 | #53 | Exceptional 11.1% |
| Mongolians | 98.9 /100 | #54 | Exceptional 11.1% |
| Irish | 98.9 /100 | #55 | Exceptional 11.1% |