Australian vs Polish Unemployment Among Youth under 25 years
COMPARE
Australian
Polish
Unemployment Among Youth under 25 years
Unemployment Among Youth under 25 years Comparison
Australians
Poles
10.9%
UNEMPLOYMENT AMONG YOUTH UNDER 25 YEARS
99.6/ 100
METRIC RATING
47th/ 347
METRIC RANK
11.0%
UNEMPLOYMENT AMONG YOUTH UNDER 25 YEARS
99.3/ 100
METRIC RATING
48th/ 347
METRIC RANK
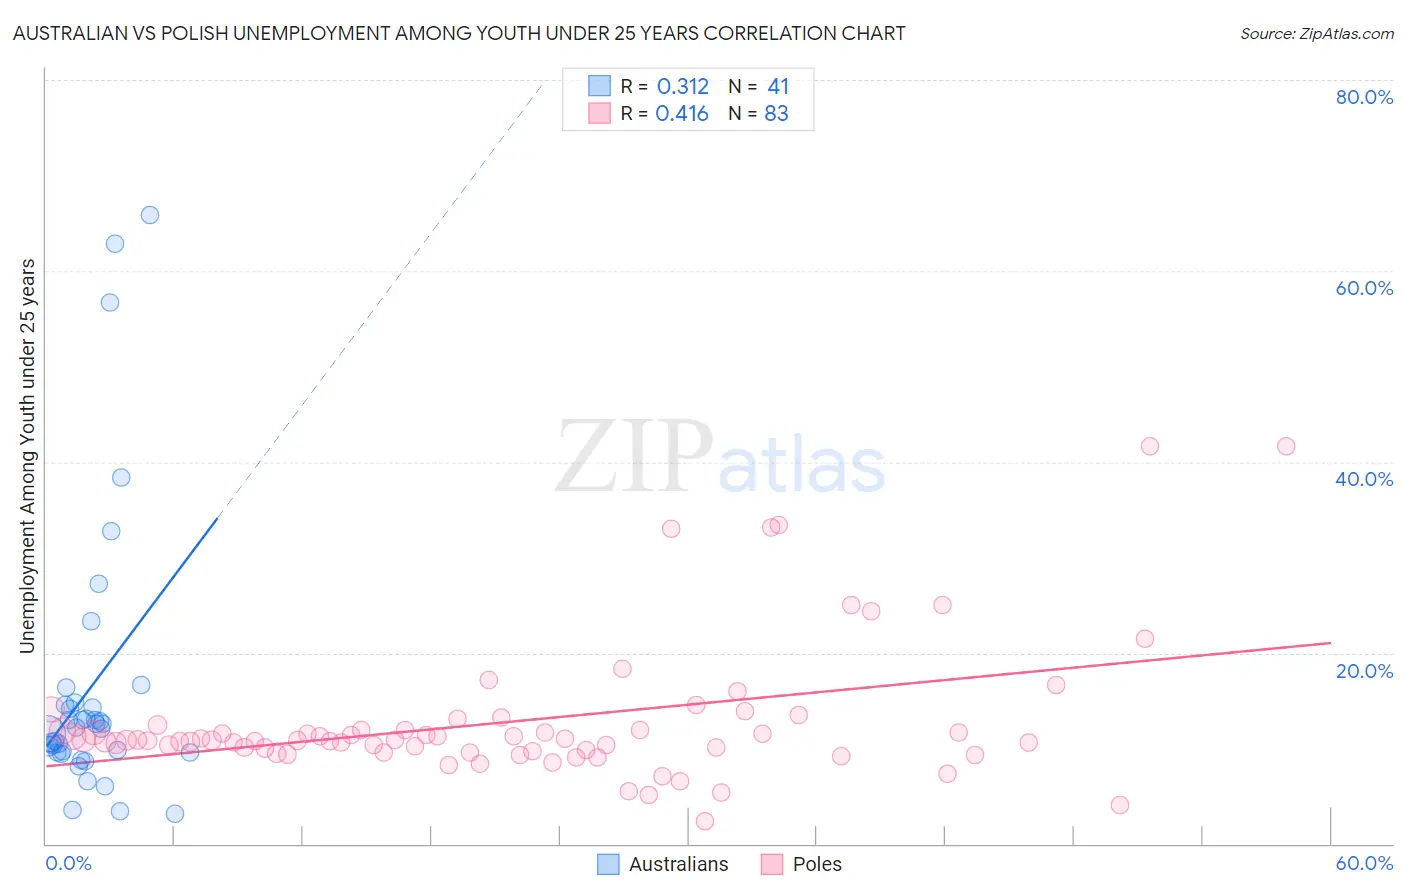
Australian vs Polish Unemployment Among Youth under 25 years Correlation Chart
The statistical analysis conducted on geographies consisting of 222,175,762 people shows a mild positive correlation between the proportion of Australians and unemployment rate among youth under the age of 25 in the United States with a correlation coefficient (R) of 0.312 and weighted average of 10.9%. Similarly, the statistical analysis conducted on geographies consisting of 537,929,649 people shows a moderate positive correlation between the proportion of Poles and unemployment rate among youth under the age of 25 in the United States with a correlation coefficient (R) of 0.416 and weighted average of 11.0%, a difference of 0.56%.
Unemployment Among Youth under 25 years Correlation Summary
| Measurement | Australian | Polish |
| Minimum | 3.2% | 2.4% |
| Maximum | 65.8% | 41.6% |
| Range | 62.6% | 39.2% |
| Mean | 16.4% | 12.8% |
| Median | 12.2% | 10.8% |
| Interquartile 25% (IQ1) | 9.6% | 9.7% |
| Interquartile 75% (IQ3) | 14.6% | 12.0% |
| Interquartile Range (IQR) | 5.1% | 2.3% |
| Standard Deviation (Sample) | 14.7% | 7.2% |
| Standard Deviation (Population) | 14.5% | 7.2% |
Demographics Similar to Australians and Poles by Unemployment Among Youth under 25 years
In terms of unemployment among youth under 25 years, the demographic groups most similar to Australians are Tongan (10.9%, a difference of 0.040%), Bulgarian (10.9%, a difference of 0.080%), Welsh (10.9%, a difference of 0.19%), British (10.9%, a difference of 0.21%), and Cambodian (10.9%, a difference of 0.47%). Similarly, the demographic groups most similar to Poles are Thai (11.0%, a difference of 0.070%), Czechoslovakian (11.0%, a difference of 0.17%), Serbian (11.0%, a difference of 0.40%), Latvian (11.0%, a difference of 0.42%), and Ottawa (11.1%, a difference of 0.50%).
| Demographics | Rating | Rank | Unemployment Among Youth under 25 years |
| Immigrants | Zimbabwe | 99.8 /100 | #37 | Exceptional 10.8% |
| Immigrants | Congo | 99.8 /100 | #38 | Exceptional 10.9% |
| Immigrants | Zaire | 99.8 /100 | #39 | Exceptional 10.9% |
| Scottish | 99.8 /100 | #40 | Exceptional 10.9% |
| Croatians | 99.8 /100 | #41 | Exceptional 10.9% |
| Cambodians | 99.7 /100 | #42 | Exceptional 10.9% |
| British | 99.7 /100 | #43 | Exceptional 10.9% |
| Welsh | 99.7 /100 | #44 | Exceptional 10.9% |
| Bulgarians | 99.6 /100 | #45 | Exceptional 10.9% |
| Tongans | 99.6 /100 | #46 | Exceptional 10.9% |
| Australians | 99.6 /100 | #47 | Exceptional 10.9% |
| Poles | 99.3 /100 | #48 | Exceptional 11.0% |
| Thais | 99.3 /100 | #49 | Exceptional 11.0% |
| Czechoslovakians | 99.2 /100 | #50 | Exceptional 11.0% |
| Serbians | 99.0 /100 | #51 | Exceptional 11.0% |
| Latvians | 99.0 /100 | #52 | Exceptional 11.0% |
| Ottawa | 99.0 /100 | #53 | Exceptional 11.1% |
| Mongolians | 98.9 /100 | #54 | Exceptional 11.1% |
| Irish | 98.9 /100 | #55 | Exceptional 11.1% |
| Immigrants | Saudi Arabia | 98.8 /100 | #56 | Exceptional 11.1% |
| Immigrants | Eritrea | 98.8 /100 | #57 | Exceptional 11.1% |