French American Indian vs Macedonian Unemployment Among Women with Children Under 6 years
COMPARE
French American Indian
Macedonian
Unemployment Among Women with Children Under 6 years
Unemployment Among Women with Children Under 6 years Comparison
French American Indians
Macedonians
9.2%
UNEMPLOYMENT AMONG WOMEN WITH CHILDREN UNDER 6 YEARS
0.0/ 100
METRIC RATING
311th/ 347
METRIC RANK
7.2%
UNEMPLOYMENT AMONG WOMEN WITH CHILDREN UNDER 6 YEARS
97.7/ 100
METRIC RATING
94th/ 347
METRIC RANK
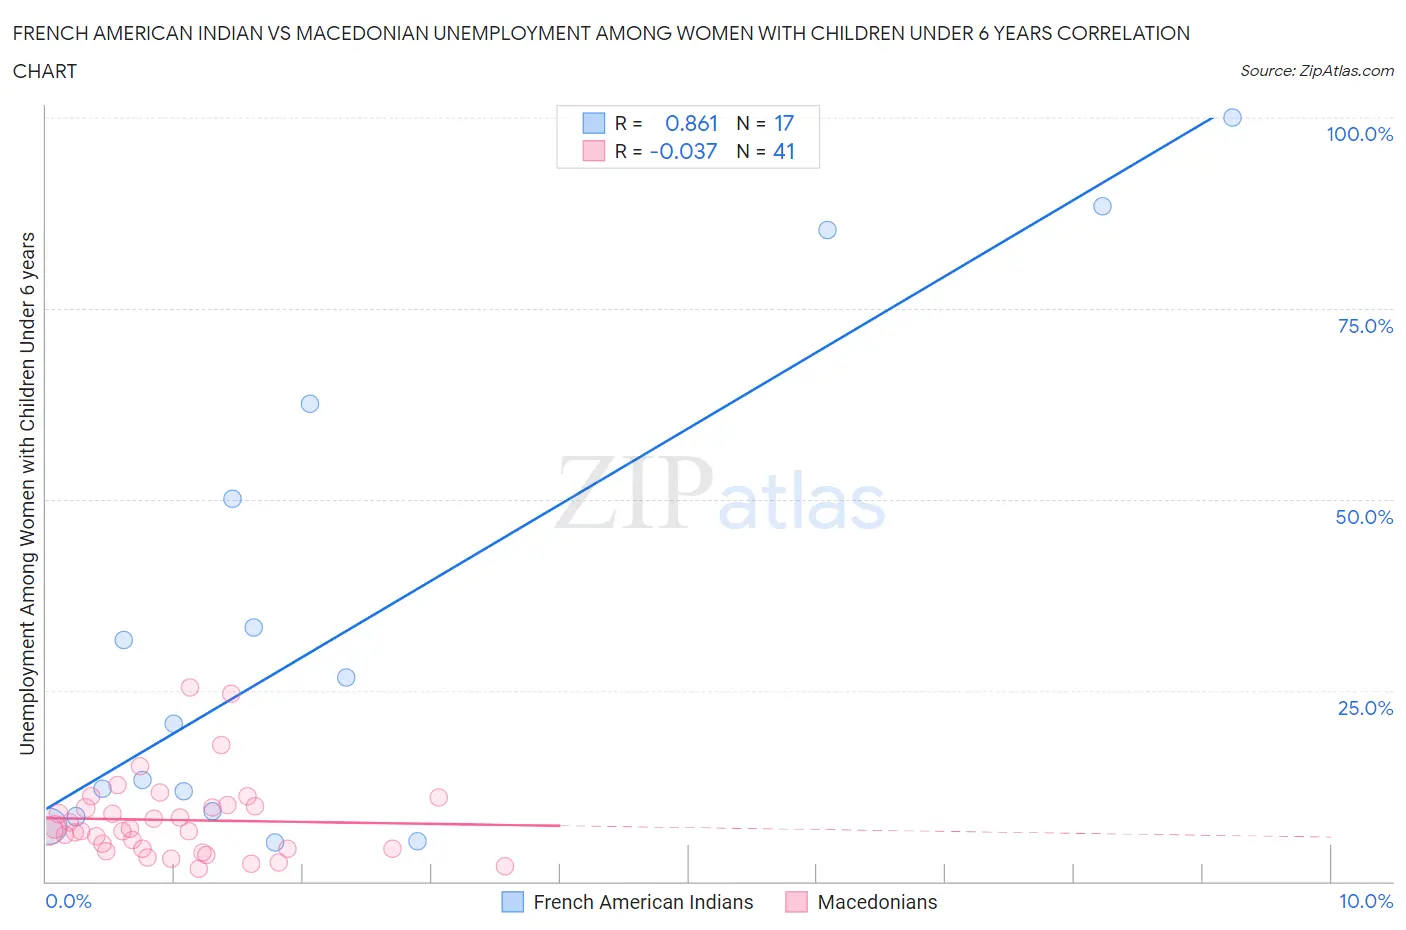
French American Indian vs Macedonian Unemployment Among Women with Children Under 6 years Correlation Chart
The statistical analysis conducted on geographies consisting of 112,876,255 people shows a very strong positive correlation between the proportion of French American Indians and unemployment rate among women with children under the age of 6 in the United States with a correlation coefficient (R) of 0.861 and weighted average of 9.2%. Similarly, the statistical analysis conducted on geographies consisting of 112,540,852 people shows no correlation between the proportion of Macedonians and unemployment rate among women with children under the age of 6 in the United States with a correlation coefficient (R) of -0.037 and weighted average of 7.2%, a difference of 28.3%.
Unemployment Among Women with Children Under 6 years Correlation Summary
| Measurement | French American Indian | Macedonian |
| Minimum | 5.0% | 1.7% |
| Maximum | 100.0% | 25.3% |
| Range | 95.0% | 23.6% |
| Mean | 33.6% | 8.0% |
| Median | 20.5% | 6.6% |
| Interquartile 25% (IQ1) | 8.8% | 4.3% |
| Interquartile 75% (IQ3) | 56.3% | 9.9% |
| Interquartile Range (IQR) | 47.5% | 5.6% |
| Standard Deviation (Sample) | 31.9% | 5.3% |
| Standard Deviation (Population) | 31.0% | 5.2% |
Similar Demographics by Unemployment Among Women with Children Under 6 years
Demographics Similar to French American Indians by Unemployment Among Women with Children Under 6 years
In terms of unemployment among women with children under 6 years, the demographic groups most similar to French American Indians are Immigrants from the Azores (9.2%, a difference of 0.14%), Cajun (9.2%, a difference of 0.28%), African (9.2%, a difference of 0.41%), American (9.3%, a difference of 0.58%), and Fijian (9.3%, a difference of 0.61%).
| Demographics | Rating | Rank | Unemployment Among Women with Children Under 6 years |
| Immigrants | Mexico | 0.0 /100 | #304 | Tragic 9.1% |
| Alaskan Athabascans | 0.0 /100 | #305 | Tragic 9.1% |
| Pueblo | 0.0 /100 | #306 | Tragic 9.1% |
| Dominicans | 0.0 /100 | #307 | Tragic 9.1% |
| Immigrants | Micronesia | 0.0 /100 | #308 | Tragic 9.1% |
| Africans | 0.0 /100 | #309 | Tragic 9.2% |
| Cajuns | 0.0 /100 | #310 | Tragic 9.2% |
| French American Indians | 0.0 /100 | #311 | Tragic 9.2% |
| Immigrants | Azores | 0.0 /100 | #312 | Tragic 9.2% |
| Americans | 0.0 /100 | #313 | Tragic 9.3% |
| Fijians | 0.0 /100 | #314 | Tragic 9.3% |
| Cherokee | 0.0 /100 | #315 | Tragic 9.3% |
| Houma | 0.0 /100 | #316 | Tragic 9.4% |
| Dutch West Indians | 0.0 /100 | #317 | Tragic 9.5% |
| Osage | 0.0 /100 | #318 | Tragic 9.5% |
Demographics Similar to Macedonians by Unemployment Among Women with Children Under 6 years
In terms of unemployment among women with children under 6 years, the demographic groups most similar to Macedonians are Romanian (7.2%, a difference of 0.040%), Immigrants from Eastern Africa (7.2%, a difference of 0.060%), New Zealander (7.2%, a difference of 0.070%), Immigrants from South Eastern Asia (7.2%, a difference of 0.13%), and Russian (7.2%, a difference of 0.17%).
| Demographics | Rating | Rank | Unemployment Among Women with Children Under 6 years |
| Alsatians | 98.4 /100 | #87 | Exceptional 7.1% |
| Immigrants | Hungary | 98.3 /100 | #88 | Exceptional 7.1% |
| Immigrants | Denmark | 98.3 /100 | #89 | Exceptional 7.1% |
| Immigrants | Spain | 98.2 /100 | #90 | Exceptional 7.1% |
| Danes | 98.2 /100 | #91 | Exceptional 7.1% |
| Albanians | 98.0 /100 | #92 | Exceptional 7.2% |
| New Zealanders | 97.8 /100 | #93 | Exceptional 7.2% |
| Macedonians | 97.7 /100 | #94 | Exceptional 7.2% |
| Romanians | 97.7 /100 | #95 | Exceptional 7.2% |
| Immigrants | Eastern Africa | 97.7 /100 | #96 | Exceptional 7.2% |
| Immigrants | South Eastern Asia | 97.6 /100 | #97 | Exceptional 7.2% |
| Russians | 97.5 /100 | #98 | Exceptional 7.2% |
| Immigrants | Europe | 97.5 /100 | #99 | Exceptional 7.2% |
| Immigrants | Northern Europe | 97.4 /100 | #100 | Exceptional 7.2% |
| Chileans | 97.4 /100 | #101 | Exceptional 7.2% |