Ethiopian vs Immigrants from Cabo Verde Unemployment Among Ages 16 to 19 years
COMPARE
Ethiopian
Immigrants from Cabo Verde
Unemployment Among Ages 16 to 19 years
Unemployment Among Ages 16 to 19 years Comparison
Ethiopians
Immigrants from Cabo Verde
17.8%
UNEMPLOYMENT AMONG AGES 16 TO 19 YEARS
29.6/ 100
METRIC RATING
198th/ 347
METRIC RANK
18.4%
UNEMPLOYMENT AMONG AGES 16 TO 19 YEARS
2.0/ 100
METRIC RATING
240th/ 347
METRIC RANK
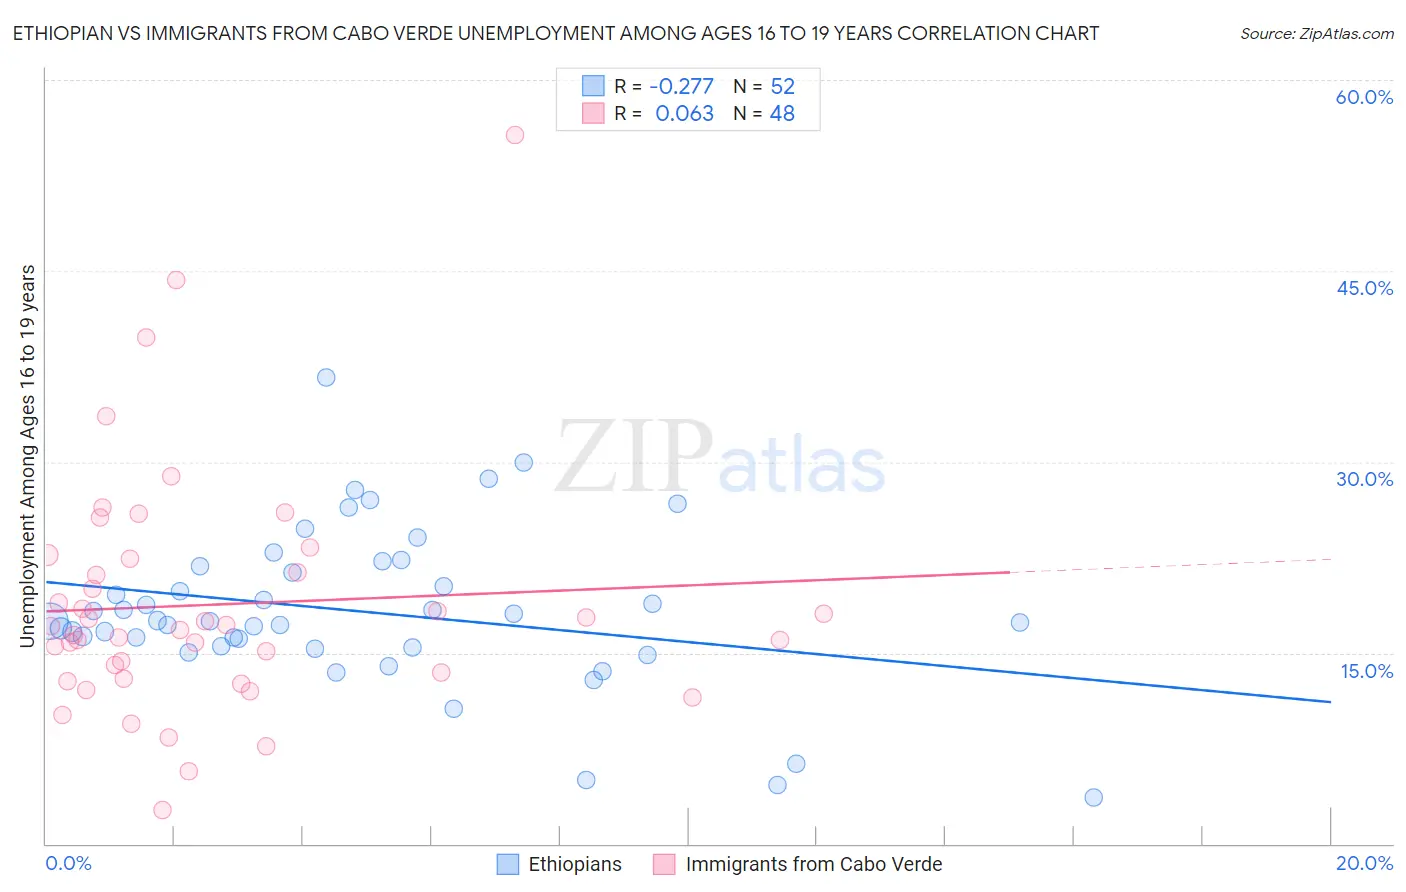
Ethiopian vs Immigrants from Cabo Verde Unemployment Among Ages 16 to 19 years Correlation Chart
The statistical analysis conducted on geographies consisting of 217,412,763 people shows a weak negative correlation between the proportion of Ethiopians and unemployment rate among population between the ages 16 and 19 in the United States with a correlation coefficient (R) of -0.277 and weighted average of 17.8%. Similarly, the statistical analysis conducted on geographies consisting of 37,702,404 people shows a slight positive correlation between the proportion of Immigrants from Cabo Verde and unemployment rate among population between the ages 16 and 19 in the United States with a correlation coefficient (R) of 0.063 and weighted average of 18.4%, a difference of 3.5%.
Unemployment Among Ages 16 to 19 years Correlation Summary
| Measurement | Ethiopian | Immigrants from Cabo Verde |
| Minimum | 3.6% | 2.7% |
| Maximum | 36.6% | 55.7% |
| Range | 33.0% | 53.0% |
| Mean | 18.2% | 18.8% |
| Median | 17.5% | 17.0% |
| Interquartile 25% (IQ1) | 15.5% | 13.3% |
| Interquartile 75% (IQ3) | 21.6% | 21.9% |
| Interquartile Range (IQR) | 6.1% | 8.6% |
| Standard Deviation (Sample) | 6.3% | 9.5% |
| Standard Deviation (Population) | 6.2% | 9.4% |
Similar Demographics by Unemployment Among Ages 16 to 19 years
Demographics Similar to Ethiopians by Unemployment Among Ages 16 to 19 years
In terms of unemployment among ages 16 to 19 years, the demographic groups most similar to Ethiopians are Immigrants from Czechoslovakia (17.8%, a difference of 0.010%), Immigrants from Ireland (17.8%, a difference of 0.060%), Immigrants from Fiji (17.8%, a difference of 0.11%), Immigrants from Ethiopia (17.8%, a difference of 0.13%), and Immigrants from Portugal (17.8%, a difference of 0.14%).
| Demographics | Rating | Rank | Unemployment Among Ages 16 to 19 years |
| Immigrants | Costa Rica | 41.3 /100 | #191 | Average 17.6% |
| Immigrants | Philippines | 40.7 /100 | #192 | Average 17.7% |
| Immigrants | Australia | 40.6 /100 | #193 | Average 17.7% |
| Peruvians | 38.8 /100 | #194 | Fair 17.7% |
| Immigrants | Peru | 37.3 /100 | #195 | Fair 17.7% |
| Alaskan Athabascans | 34.1 /100 | #196 | Fair 17.7% |
| Immigrants | Czechoslovakia | 29.8 /100 | #197 | Fair 17.8% |
| Ethiopians | 29.6 /100 | #198 | Fair 17.8% |
| Immigrants | Ireland | 28.5 /100 | #199 | Fair 17.8% |
| Immigrants | Fiji | 27.7 /100 | #200 | Fair 17.8% |
| Immigrants | Ethiopia | 27.4 /100 | #201 | Fair 17.8% |
| Immigrants | Portugal | 27.2 /100 | #202 | Fair 17.8% |
| Immigrants | Eastern Europe | 23.6 /100 | #203 | Fair 17.8% |
| Immigrants | Nonimmigrants | 20.9 /100 | #204 | Fair 17.9% |
| Assyrians/Chaldeans/Syriacs | 20.8 /100 | #205 | Fair 17.9% |
Demographics Similar to Immigrants from Cabo Verde by Unemployment Among Ages 16 to 19 years
In terms of unemployment among ages 16 to 19 years, the demographic groups most similar to Immigrants from Cabo Verde are Native Hawaiian (18.3%, a difference of 0.22%), South American (18.3%, a difference of 0.30%), Immigrants (18.3%, a difference of 0.32%), Immigrants from Colombia (18.3%, a difference of 0.33%), and French American Indian (18.3%, a difference of 0.40%).
| Demographics | Rating | Rank | Unemployment Among Ages 16 to 19 years |
| Seminole | 4.0 /100 | #233 | Tragic 18.2% |
| Colombians | 3.7 /100 | #234 | Tragic 18.3% |
| French American Indians | 2.9 /100 | #235 | Tragic 18.3% |
| Immigrants | Colombia | 2.7 /100 | #236 | Tragic 18.3% |
| Immigrants | Immigrants | 2.7 /100 | #237 | Tragic 18.3% |
| South Americans | 2.6 /100 | #238 | Tragic 18.3% |
| Native Hawaiians | 2.4 /100 | #239 | Tragic 18.3% |
| Immigrants | Cabo Verde | 2.0 /100 | #240 | Tragic 18.4% |
| Immigrants | Ukraine | 1.3 /100 | #241 | Tragic 18.5% |
| Moroccans | 1.1 /100 | #242 | Tragic 18.5% |
| Mexicans | 0.9 /100 | #243 | Tragic 18.5% |
| Guatemalans | 0.8 /100 | #244 | Tragic 18.6% |
| Immigrants | Belarus | 0.8 /100 | #245 | Tragic 18.6% |
| Immigrants | South America | 0.5 /100 | #246 | Tragic 18.7% |
| Immigrants | Israel | 0.5 /100 | #247 | Tragic 18.7% |